What is Market Structure?

Market Structure
Everyone has at some point in time in their life, lost their way on an outing. This is especially true in the pre-Google days when roads could not be found on the Google map. The frustration and anxiety of being lost in an unknown land are difficult to describe.
Yet we see traders, especially novice traders, being lost in the market and continuing to trade without a clue about the market trend and the current state of the market. No wonder we have more losers in the market than winners.
Market structure is one way of locating where the market is present, the trend of the market and which are the areas that offer high probability trades.
Market structure helps dissect the price chart of the stock or indices and helps in generating high probability trading ideas. Such kind of trading is generally used by price action traders who do not use any indicators to trade.
Defining the structure
Many traders use multi-timeframes to define a market structure. They mark the contours or the boundary of the market in which they believe the market will spend its time. In order to do so, they draw support and resistance lines at the higher time frames.
Let’s try to understand the market structure. To do so, we need to first understand the concept of support and resistance.
Support and Resistance
Support and resistance levels are actually zones where prices have visited earlier and stayed there for a while before rebounding. An important point to note is that these are not necessarily a level or a point from which price reverses. These are zones or areas where price spends some time.
When the price of a stock is falling, it is likely to bounce back from its support level. Price takes support in these zones, where more buyers jump in the market and overcome selling power, thus taking prices higher.
Similarly, when the price of a stock is moving up, the price tends to find resistance at some level from where it reverses its trend. At these levels, more sellers come to market, absorbing the buying force and sending prices lower.
The graph of Nifty explains the area of support and resistance.
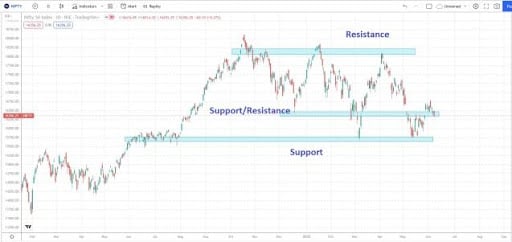
Note how Nifty consolidated between June and August 2021 in a small range after which it shot up. But after creating a top in mid-October, the Nifty again started falling till it reached the same consolidation zone in March 2022.
After a fast rebound, where the price shot to a resistance zone created in the December 2021 and January 2022, top market again started falling, only to stop at the same consolidation zone.
Thus, support levels are areas to watch in a falling market to look for a low-risk entry point. These are areas that offer one of the best risk-reward trades.
Similarly, in a rising market, the resistance zone is the area to look out for the exit of your long positions. These areas also offer a good risk-reward shorting opportunity.
In pure demand and supply terms, support is an area where buyers are likely to overwhelm sellers, resulting in the stock price going up. On the other hand, resistance is an area where sellers overwhelm buyers, resulting in a fall in stock price.
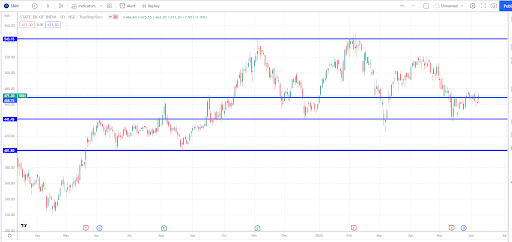
Dual Role
A good point about these support and resistance zones is that the same area can act as a resistance in a rising market and support in a falling market.
The chart shown above shows an area in the middle where the price bounced back sharply in mid-December 2021. This was also the area that was again tested in late February and early March for a brief moment, and the price again fell through it to stop at the long-term support zone.
Where can we find areas of support and resistance?
The most common areas from where price reverts are the previous top and bottom. One point to remember is that the previous top and bottom should be clearly visible and stand out. Small tops and bottoms made in a narrow range do not count.
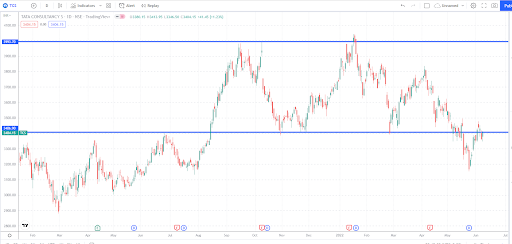
The chart above is the daily price chart of SBI. Notice how prominent tops and bottoms act as good support and resistance.
Smaller tops and bottoms, which are between trends do not carry any weight. An important point worth noting is that the more number of times a stock tests a support or resistance area and bounces back, the more significant is that zone.
Check the 440 price area in SBI’s chart which has been tested repeatedly both as a support and a resistance.
Significance of market structure
Market structure helps define the playing field, especially for an intraday player. For those traders who trade on the daily timeframe market structure can be created on a higher time frame, like the weekly timeframe.
The chart below is of TCS on a weekly timeframe.
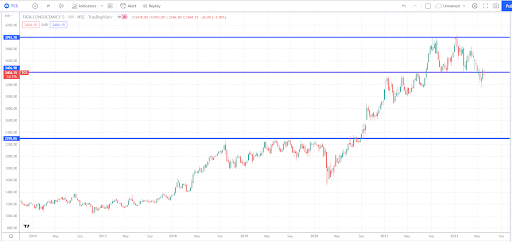
Notice how TCS has behaved at the recent tops and bottoms. We shall now look at the same chart on the daily time frame.
Frequently Asked Questions
What is market structure?
Market structure helps to understand where the market is currently vis-à-vis important turning points. It helps dissect the price chart of the stock or indices and generates high probability trading ideas.
A market structure is mainly used by short term traders, especially intraday traders, but it works equally well with long term traders.
Why are support and resistance important?
Support and resistances are areas from where stock and indices can change direction. These are high probability areas from where the market turns and offers a low risk trading opportunity.
What is multi-timeframe trading?
Multi-time frame trading involves using different timeframes to trade. A structure of the market is prepared at a higher timeframe using support and resistance areas. Entry and exits are identified using either candlestick patterns or price actions in the lower time frame. This result is a very high probability and low risk trade.


How Would You Rate This Chapter?
Next
Comments (0)