Market Trends and Trends within trends

Investing in stocks is about estimating and backing the movement in the share price.
The movement in the share price is never in one direction. Based on the sentiment, demand, and supply the move could be upwards or downwards and even sideways.
Knowing the trend, the stock is moving in is the key to making the right investment decision.
The study and analysis of this element in technical analysis is called Trend Analysis.
What is Trend Analysis?
Trend analysis is a basic but important part of technical analysis.
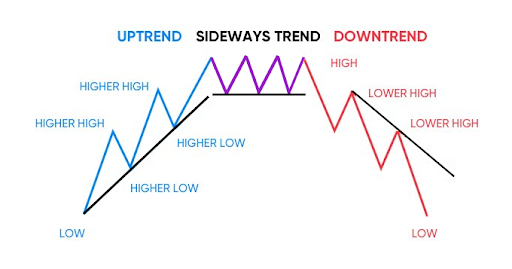
It is used by traders and investors to identify the current price trends of a stock. Based on the indicators a trend can be identified which can be in an uptrend, downtrend, or sideways trend.
These trends combined with other indicators are used by investors to place a buy or sell transaction.
Uptrend
As the name suggests in an uptrend the share price moves in an upward direction.
In this trend, the direction movement makes a higher top and higher bottom. This means that the closing share price is higher than the previous high price and the closing low price is higher than the previous closing price.
Let’s assume an investor wants to buy a stock at Rs 200 but loses the opportunity. The share now moves up to Rs 220 making its first top.
The stock moves lower but the same investor does not expect it to go below Rs 200. He buys at a price higher than Rs 200 or Rs 210 which is higher than the previous close.
The stock has now created a higher bottom or support. This indicator gets other investors interested as well and the price starts moving up. The demand pushes it above Rs 220 and a close of Rs 240.
Thus, forming a higher top and higher bottom. If you draw a trend line connecting the highs and lows it will slope upwards.
This signals an uptrend in the share price.
Downtrend
In this trend, the direction movement makes a lower high and lower low. This means that the closing share price is lower than the previous high closing price and the closing low price is lower than the previous closing low.
Signalling a downtrend in the share price.
If there is a bearish sentiment in the market investors would be willing to sell at the next best price available.
Let’s assume an investor wants to sell a stock at Rs 100 but is unable to do so. If the stock falls to Rs 80 he would take that opportunity to sell creating a lower high for the share price.
The negativity around the stock will push it lower to form new lows resulting in a trend that slopes downward.
Sideways trend
In a sideways trend, the stock prices move in a tight range.
They do not make higher highs or lower lows and there is no clear breakout on either side during this period.
It means that the prices will continue to move in the same direction they have been moving in the past.
In a sideways trend, buyers will buy at a particular price that does not have too much variance and sell at a particular level to keep the share price in a channel.
These levels are called support on the upper side and resistance levels on the lower side.
This normally occurs when the forces of demand and supply are equal leading to a horizontal price movement.
A sideways trend is also called a period of consolidation in share prices.
During a sideways movement if the price breaks above a resistance level and continues to create new highs it could signal a bull market. On the other hand, if it breaks resistance levels and creates new lows it is the beginning of a bearish market.
Trend within trends
According to the Dow Theory, there are three trends that the markets go through.
Primary Trend
Secondary Trend
Minor Trend
Dow has compared these three trends to a tide, waves, and ripples in the oceans. The primary trend is the tide. The secondary trends are like waves in that tide and minor trend ripples on the waves.
Primary Trend
The three trends discussed above Uptrend, downtrend, and sideways trend are what can be termed primary trends.
According to the Dow Theory, there is an uptrend if each successive close is higher than the previous close. Similarly, the lows are higher than every previous low.
Comparing it to the oceans each wave that hits the shore is further inland than the previous wave that came in.
If the opposite happens where each successive low is lower than the previous low the market is in a downtrend. Which is saying that each successive wave that comes in is further away from the shore than the previous one.
A pattern of rising peaks and bottoms (high and low) is an uptrend while lower peaks and lower bottoms are a downtrend.
Primary trends are of a longer-term and can last for more than a year or more.
Secondary Trend
A secondary trend is basically a correction in a bullish market and rallies in a bearish market.
They signal a correction within the primary trend and move in the opposite direction. This correction can be anywhere between one-third and two-thirds of the previous movement.
They are shorter compared to the primary trend and can last from around three weeks to three months.
Secondary trends have been likened to waves in the tide.
Minor Trend
Taking the ocean analogy further minor trends can be for a few hours to days and are referred to as market noise. They are not considered reliable to track market trends and are mostly fluctuations in the secondary or intermediate trend.
Conclusion
- Trend analysis is a technical indicator investors follow to determine share price movement.
- Trends are made up of highs and lows, allowing one to predict the overall direction of the movement.
- Trend analysis should not be used in isolation and should be used in addition to other indicators.
FAQs
What is a trend?
One of the basic things to know for a trader is the trend of the market or a stock. A trend is nothing but the direction of the price movement of the underlying.
If prices are moving higher they are said to be in an uptrend. They are said to be in a downtrend if prices are moving down. While if prices are gyrating in a narrow range there are said to be in a sideways direction.
Why are trends important?
The probability of making money is higher if a trader takes position in the side of the trend. Catching a falling knife or trading against the trend is considered to be a risky strategy. Traders combine trend with momentum to make a fast buck in direction of the move.
Which is a high probability trend strategy?
A stock or an index that is trending in the same direction in multiple timeframes has a high probability of succeeding. For example if a company is in a bullish trend in the monthly, weekly and daily time frame, then it has a high probability of succeeding.
One can keep on adding more time frames like an hourly or a 15 minute timeframe but take trades only when all trends align.
Learn about the trends with other indicators used to place a buy or sell transaction.


How Would You Rate This Chapter?
Next
Comments (0)