Bollinger Bands- Meaning and Trading Strategies
Bollinger Bands – the playing fields
Ever since our childhood, we are exhorted not to be an average person or an average student. This obsession of not being an average person follows us in our jobs where, in fact, the entire company does not want to be labeled as an average company. In any field, be it sports, arts, business, or science, being average is looked down upon.
Yet as much as we try to run away from being ‘average’ most of us remain an average person. Let’s take the case of a classroom. Only a few students are exceptionally intelligent, and few might be really bad in their studies. Now let’s take cricket in India – millions play the game, but there is only a handful who make it big. The same goes for movies or any other field.
If we leave the extremes out, we still have different grades of average. Like in society, few people are uber rich while some are extremely poor. But a bulk of the population fall in the middle class, or the ‘average’ bracket. Here too, the gradation is between the upper middle class and lower middle class.
Now if a statistician would have been reading this, he would immediately think of the normal distribution curve. Also known as Gaussian distribution, it basically says how data is distributed. The Gaussian curve has two statistical terms known as ‘mean’ and ‘standard deviation’. While the mean is also known as the average, standard deviation informs us about the distance the data point is from the mean. Standard Deviation is also a measure of volatility where the current price can be seen in reference to its possible extremes.
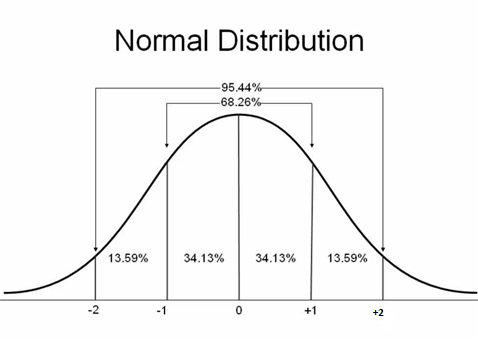
As the curve shows around 68.3 percent of the data reside near the mean or the ‘average’ we spoke about above. This also happens to be at a distance of 1 standard deviation on either side of the average. At 2 standard deviations, we have 95 percent of the data. And 99.7 percent of the data falls under three standard deviations.
This information is very useful for market participants. Say, if the price crosses a 2 standard deviation point, then we know that it has reached an extreme, a zone where it is not supposed to be 95 percent of the time. Using this information, a very important tool named Bollinger Bands was developed by John Bollinger.
Bollinger Bands
Construction of Bollinger Band requires a mean value of the prices over a period of time. Most analysts use the 20 or 21-day period, which generally represents one month of data, to calculate the mean value.
After the mean value is deduced Bollinger bands are drawn using two standard deviations (positive and negative). Most modern software gives traders the flexibility of adjusting the number of days for arriving at the ‘mean’ value as well as the standard deviation value.
Some conservative traders would like to use graphs with 3 standard deviations instead of 2, thus searching for those rare events which are unlikely to occur 99.7 percent of the time.
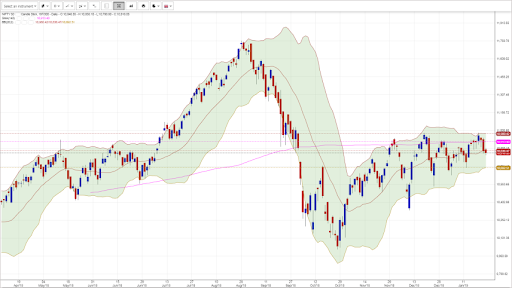
The chart above shows the Nifty 50 inside the Bollinger Bands of 2 standard deviations with a 20-day moving average. Note how the price normally stays in the band but whenever the extremes are tested they generally hold out.
Here the Bollinger Bands are serving the same purpose as that of the oscillators – defining the boundaries of share price movement. The bands tell us when the prices are touching high or low levels and the trader should take note of it.
Some traders use the Bollinger Bands as a shifting support and resistance line. This is especially helpful during periods of consolidation when the extremes are regularly tested.
What makes Bollinger Band attractive to traders is that they respond to the current market condition. If the volatility in the market is coming down, the Bollinger Bands shrink and during a high volatility period, they expand.
John Bollinger came out with 22 rules to follow in order to use the Bollinger Bands. We shall look at a few of them.
Bollinger Band Rules:
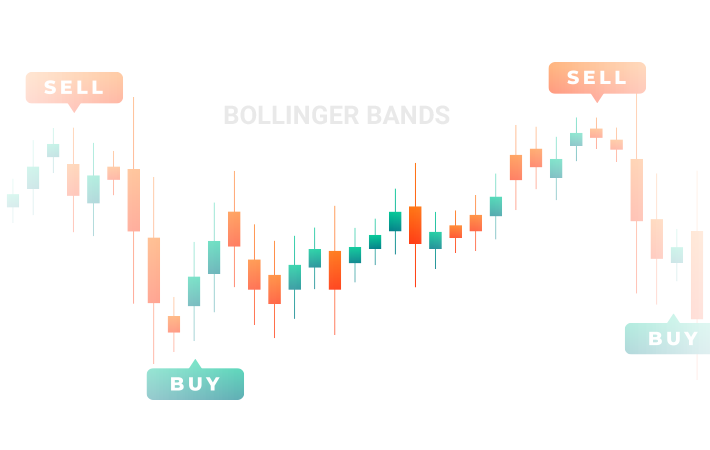
- When the price is at the upper band, it is considered to be at a high point, or near the overbought zone, and when it is at the lower band they are considered to be at a low point or near the oversold zone.
- Bollinger Bands can be used as a confirmation for recognising patterns like double tops (M-pattern) and double bottoms (W pattern)
- In a trending market price can continue to walk up the upper Bollinger Band or continue to go down holding the lower Bollinger Band.
- Closes out of the range of Bollinger Band are generally continuation signals and not reversal signals. Traders also use this as a volatility breakout signal.
- Default parameters of 20 periods moving average as a two standard deviation can be changed as per the trader’s back-testing results or as per market fit. If the average is increased then some changes need to be made to the standard deviation. According to Bollinger, if it is increased to 50 periods from the default setting of 20 periods, then the standard deviation setting should be increased to 2.1. While if it is reduced to 10 periods, then the standard deviation setting should be 1.9.
- The moving average chosen should be indicative of the intermediate trend. Traditionally simple moving average is chosen as traditional standard deviation calculations are based on them.
- In case exponential moving averages are used then it should only be done to calculate the Bollinger Bands. The reason traders use Exponential Bollinger Bands is that they eliminate sudden spikes in the prices.
- Though statistics say that a 2 sigma range means 95 percent of data is within the band, in reality, Bollinger Bands encompass 90 percent of the data.
- %b, another indicator developed by John Bollinger is an indicator of where the price is with respect to the Bollinger Bands. %b is used by traders to identify divergences and pattern recognition.
- Bandwidth, also a derivative of Bollinger Band, is used to identify ‘The Squeeze’ – the contraction of the Bollinger Bands, as well as to identify trend changes.
Like many technical indicators Bollinger Bands is also not used in isolation. It is normally combined with either an oscillator or a pattern that can be traded on. Also, the bands work in all time frames and all markets.
We shall now look at some of the popular trading strategies around Bollinger Bands used by traders.
Bollinger Band Trading Strategies
As explained earlier, Bollinger Bands define a sort of boundary within which prices move. Bollinger Bands have three main components – the Central Moving Average, Upper Band, and the Lower Band.
Trading strategies are generally designed either when price approaches these lines or in the manner in which the upper and lower bands behave.
We shall now look at some of the popular strategies used by traders.
Like other technical indicators, Bollinger Bands are not used in isolation but have another indicator to give the confirmatory signal.
Buy Low Sell High
It’s probably a cliché in the markets – buy low and sell high but the problem for a trader is how does he identify a low and a high in the market. Bollinger Bands by their very definition have helped solve this issue. Since the Bands are generally two standard deviations apart it suggests that when prices touch the extreme, especially in a flat market they would go back in the range.
The strategy here is simple – buy when the lower band is tested and sell or go short when the upper band is tested.
The advantage of this strategy is the very high reward-to-risk ratio. Profit targets can be divided into two parts – the first being the moving average line and the second being the upper band in case of longs and the lower band in case of shorts.
The only precaution one needs to take is to pick up trades where the market is range-bound.
Trend trading
While Bollinger Bands are a useful tool in flat markets, they have their use during trending markets too. In this case, the moving average line or the middle line is in play.
Prices in a trend tend to do so with corrections in the opposite direction of the trend. Here, the average line is useful as it acts as the point from which the market takes a U-turn and resumes its direction.
In the chart below, the price has tested the moving average line and moved back lower in line with the earlier trend.
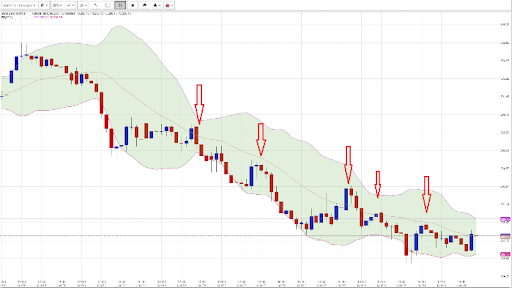
Here too, the reward is higher than the risk taken for initiating the trade. Further, stocks in a trend tend to give results faster than those in a flat market.
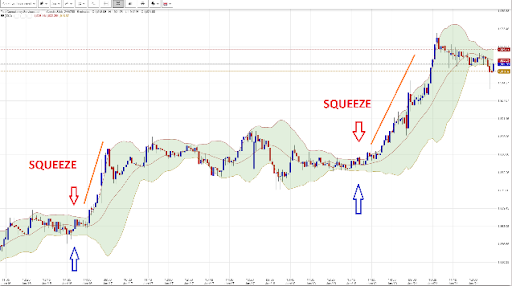
The Squeeze
One of the most prominent features of the Bollinger Band is ‘The Squeeze’. Here, both the upper band and the lower band contract are in line with the reducing volatility in the market.
The market normally goes through a cycle of rising and contracting volatility.
The issue here is how to trade the squeeze. Since the market moves in cycles many traders use option trading strategies to take advantage of an increase in volatility.
But for a directional trader or someone who bets in the cash and futures market, a ‘Squeeze’ is a puzzle. He cannot take a position till he is sure which side the market will move. Expert traders generally follow the rule that the market would continue in its original direction after a consolidation. It is thus prudent to bet in the direction of the move which preceded the contraction or the Squeeze.
Here too the risk-reward is in favour of the trader as an expansion post the Squeeze is rapid and covers a lot of distance.
Double Top Double Bottom or the ‘M Trade’ and ‘W Trade’
Bollinger Band is mostly used to identify a double top or the M-Trade and double bottom or the W-Trade.
While the double tops and double bottoms are apparent on the chart, traders use Bollinger Bands as a confirmatory tool for picking these patterns.
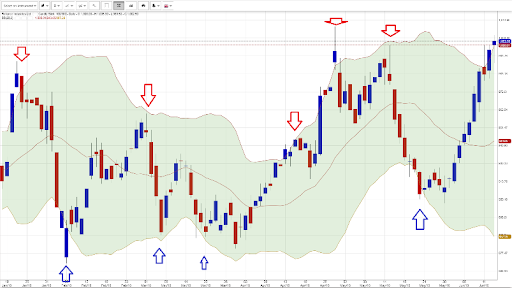
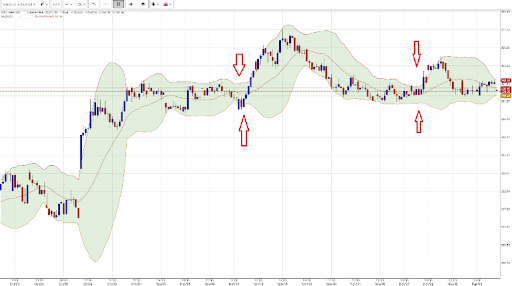
The chart below shows a Double top or M-Trade. The price penetrates the upper Bollinger Band in the first instance and, during the retest, it fails to touch the Band and falls back in the range.
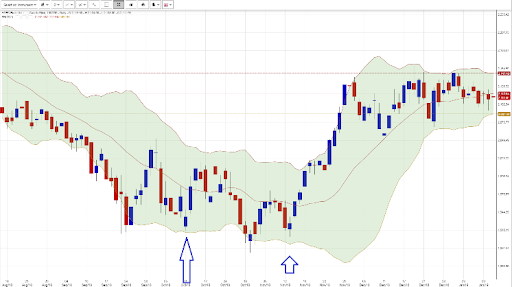
In the case of a double bottom or the W-Trade, the stock penetrates the lower Bollinger Band, and the test of the low is made inside the bands without touching it. The chart below shows how twice prices crossed through the lower band, but the retest was well within the band.
Bollinger Band Breakouts
One of the rules of John Bollinger is that a move out of the upper or lower band is normally a sign of continuation, rather than reversal. Yet, many traders and trading strategies have been developed using the bands as extreme boundaries from where the price has to reverse.
This may be true in the case where the market moves in a narrow range. But when the volatility is expanding, it is better to trade along the line of the trend.
Riding the bands as some the traders call it, these strategies give the best results when they appear after ‘The Squeeze’.
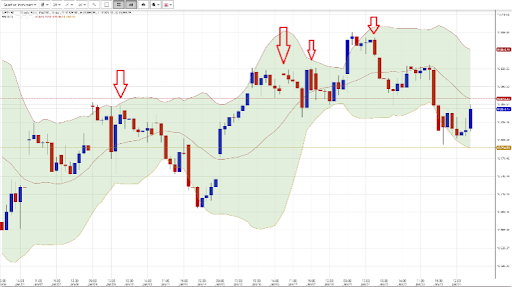
The chart below shows a runaway market after the Squeeze.
Many strategies are built using the Bollinger Bands, but a key feature is that these need to be used along with another indicator or price action before being put to use.
Conclusion:
Bollinger Bands are one of the most popular technical indicators in the market. All trading software are equipped with Bollinger Bands and traders can play around with the numbers to select the parameters that suits their market and their trading style.
A variety of trading strategies on a standalone basis and in combination with other indicators can be applied using this indicator.


How Would You Rate This Chapter?
Next
Comments (0)