Gaps in Stock Market

A person sitting on the bench in a park feels some movement on his feet, he looks down and sees a mouse nibbling at his shoes. His immediate reaction naturally would be to shout and jump. Now if the same person sees a long-lost school friend taking a stroll in the park he would jump and rush to meet him.
It’s human nature to react to a shock or a surprise differently than what would be construed as normal behaviour.
This behaviour is not restricted to individuals but is seen in crowd behaviour too. Public reaction when a goal is scored in a football match or a player hits a six in cricket is the same as the man in the park.
Markets have their way of reacting to shocks and surprises, it is called Gaps.
Gaps in markets
Suppose a company makes an important positive announcement after the market was closed, what happens to the stock price the next day. There would be a rush to buy the stock the moment the market opens. Sellers, on the other hand, would like to hold back on their selling and wait for a better price.
This results in the price bouncing higher or opening at a much higher price than the high of the previous day. On the price chart, this would be represented by a vacant space which is known as Gap.
The same is true when some adverse news hits the market post-closing. The next morning, everyone would be lining up to get out of the stock the next day, while the buyers would be willing to wait for a better price. This would result in a lower gap opening.
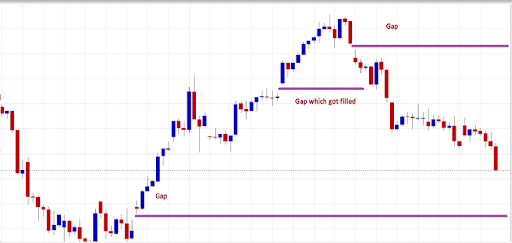
The chart above shows three gaps in prices. The gap in the middle is the one that got filled when the price went through it. Note how the gap acted as temporary support to the price.
The first gap from the left is called a ‘Gap Up’ in price while the last one on the right-hand top corner is a ‘Gap Down’ in price.
Price gaps need not be at the end of the day. News flows through the market every minute. Prices react to the news differently. If it is uneventful news, markets or the stock will continue in its original trend. But if the news is important, then gaps can occur during the day. Gaps are common in all timeframes.
However, as we move into a higher time frame, the gaps that are seen in the lower timeframe disappear. Thus, a gap that is visible on the daily chart may not be seen on the monthly, quarterly, or yearly chart, unless the gap has occurred on the last day of the month which coincides with the quarter or the year.
Types of Gaps
Gaps have been researched very extensively by traders and technical analysts. In fact, they have been followed so closely that there are myths about them.
One of the myths is that the market comes to test the gap and close it. This may happen occasionally but is an exception rather than the norm.
This brings us to the point of types of gaps that clarifies this myth.
Breakaway Gaps
Whenever a rally starts with a gap it is identified as a Breakaway Gap. This generally occurs after the market has been consolidating for some time or has been gradually falling or rising.
A Breakaway Gap occurs when there is some positive news in the stock or a big buyer, generally, an insider finds that the stock is oversold and it is a good time to buy as he is aware of the changing fortunes of the company.
One characteristic of a Breakaway gap is that it is normally accompanied by higher than average volumes. If the gap has the support of a high volume it is generally not filled so easily. In fact, it may suggest a change in trend.
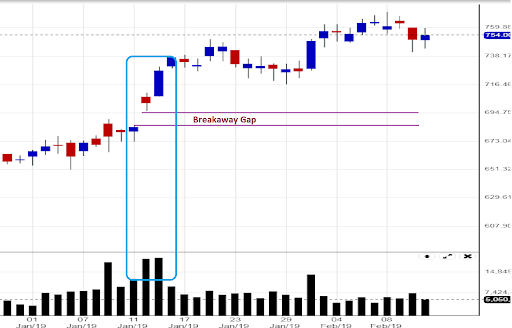
In the chart above note the breakaway gap from a consolidation. Also, note the sharp change in volume as the price breaks out of the consolidation zone. Price has not come anywhere close to the Breakaway gap to test it, leave alone to close it.
Part of the reason why Breakaway gaps have high volumes is that they are breaking out of important resistance or support levels. In the case of a resistance area shown above, traders generally short their trades by keeping a stop loss at the edge of the resistance zone. When the price gaps up these same traders rush to close their positions, in turn taking prices higher.
Runaway Gap
Gaps that form well into a strong trend are called runaway gaps. These occur on account of some positive news flow in case of an uptrend or a negative news flow in case of a falling trend. Traders who have missed the rally so far like to join in the uptrend or downtrend, as the case may be.
Here is where we introduce the second myth concerning gaps. Runaway gaps are considered by some to occur around the middle of a rising trend. It is thus sometimes called measuring gaps by some traders. What they say is that the distance from where the trend started to the gap is the same that the market can go up to, or the Runaway Gap occurs in the middle of a trend.
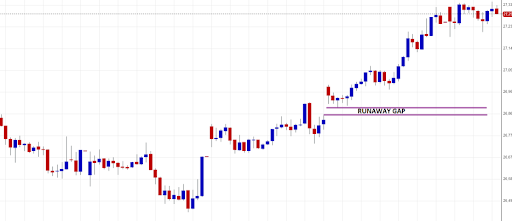
The chart above shows a Runaway Gap formed well in the trend. The price is nowhere near the middle of the trend, neither has it attempted to close it.
Exhaustion Gap
As the name suggests, these gaps are formed towards the end of the trend or when the trend is close to getting exhausted. These trends, as is the case with Breakaway gaps are followed by high volume and have bigger candles as price tends to be more volatile towards the end of the trend.
There is very little to differentiate between Exhaustion Gaps and Runaway gaps when they occur. But the key difference is that these gaps are closed soon and in fact, the market reverses and the trend changes after the gap are closed.
The reason these gaps occurs is that all those traders who have missed the rally now want to be a part of it. A gap up in a positive news flow brings in the remaining traders in the stock who have not been part of the rally. This opportunity is used by the smart trader to exit from their position.
Similarly, in a downtrend when traders have lost hope in the market they dump their shares or margin calls from their brokers force them to sell them. This creates a gap in prices which is soon reversed when the weak hands are out of the market.
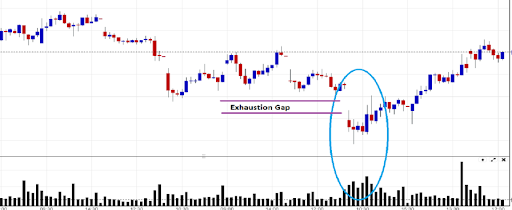
The chart above shows a steady fall in price, which ended in a climax on higher than average volume. The climax point was formed after a Gap Down in price. Weaker hands dumped their shares at these levels which were gobbled up by stronger players who then took the stock higher. Note how soon the Exhaustion Gap was closed as well as the bigger than average candles that are formed after the Exhaustion Gap.
Conclusion
Traders have used gaps in various ways. They use the gaps as an area of support and resistance that the market would try to test. Breakaway gaps are followed by trend-following traders who are alerted by the gap and the accompanying volume that there is a strong possibility of a new trend starting. They wait for an appropriate signal or a follow-up in price to ride the trend. Similarly, the Exhaustion Gaps are the ones that suggest an end to the trend. However, the Runaway Gaps are the ones that are most difficult to read and trade.


How Would You Rate This Chapter?
Next
Comments (0)