Tenets of the Dow Theory
Every market enthusiast and investor is aware and tracks the Dow Jones Industrial Average an index of the 30 prominent companies listed on the stock exchange in the United States.
This Index was made and launched by Charles Dow. This index is among his many contributions to the world of investments. He was the founder of the Dow Jones Company and also the first editor of the Wall Street Journal through which he educated about the behaviour of the stock market.
Believed to be the father of modern technical analysis from the western world Charles Dow developed the Dow Theory based on his analysis of the market action in the late 19th century. This theory laid down the initial foundation for the development of technical analysis. It is till today considered an important aspect of understanding markets and how they largely trend.
The Dow Theory is basically built on 6 Tenets.
Tenet 1
The Indices Discount Everything
The market is quick to assimilate and factor in all information that is known and available. This information is eventually reflected in the stock prices and will influence the trend in prices.
While it is difficult to predict for acts of God and natural calamities even these events ultimately get factored in and are discounted into share prices. The markets are quick to recalibrate.
Tenet 2
The market has three trends
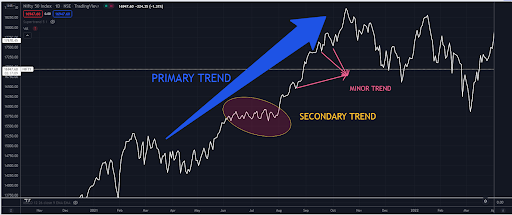
The theory says that the market moves in three trends primary, secondary and minor. Dow has compared these three trends to a tide, waves and ripples in the oceans. The primary trend is the tide. The secondary trend are like waves in that tide with the minor trend playing the role of ripples on the waves.
Primary Trend
According to this theory there is an uptrend if each successive rally closes higher than the previous rally. At the same time the lows are higher than every previous low. Which means that each wave that hits the shore in further inland then the previous wave that came in.
If the opposite happens where each successive low is lower than the previous low the market could be headed for a downtrend. Which is saying that each successive wave that comes in is further away from the shore than the previous one.
A pattern of rising peaks and troughs (high and low) is an uptrend while lower peaks and lower troughs and a downtrend.
Primary trends are said to last for more than a year or possibly more.
Secondary Trend
Secondary trend are corrections within the primary trend moving in the opposite direction. They are shorter compared to the primary trend and can last from around three weeks to three months.
The correction during this phase can be between one-third and two-third of the previous movement. Secondary trend is basically a correction in a bullish market and rallies in a bearish market.
Minor Trend
Minor trends are just referred to as market noise. This trend can be for a few hours to days. They are not considered reliable to track market trend and are mostly fluctuations in the secondary or intermediate trend.
Tenet 3
Market Trends have Three Phases
Dow theory suggest that irrespective if the markets are moving upwards or downwards there are three phases which repeat themselves.
They are the
- Accumulation phase
- Public participation phase
- Distribution phase
Accumulation phase
Smart money enters the market during the accumulation phase. Astute investors who are mostly institutional investors make their move and start accumulating shares.
After a prolonged downtrend where share prices appear to be headed nowhere, market participants get frustrated and lose hope of any recovery or rally in share prices.
With uncertainty abound and fears of further downtrend there are no buyers even though share prices tend to be at their rock bottom. The market begins to stagnate.
It is here that the astute and institutional investors sense an opportunity and the smart money enters. They realise that all the negatives have been factored into the share prices and start to accumulate stocks over a prolonged period of time.
With high volumes and buying from these investors the selling tends to get absorbed thereby giving the markets a push. Support levels start to emerge and share prices do not decline further.
Public participation phase
This is also known as the mark up phase. The institutional investors have given the market support and their buying has started to push share prices higher.
Other participants in the market like technical traders and investors see this as an opportunity and start to move in. Share prices start to move higher and at a fast phase. The rally is mostly sharp with a renewed sense of hope. But also leaves a lot of investors out because of the quick and sudden movement.
This phase is also characterised by increasing positive news flows which further strengthens belief in the uptrend. The market begins to expect higher levels which also attracts new investors. Thus, also know as the public participation phase.
Distribution phase
The distribution phase is market by increasing positive sentiments. There is a continuous flow of positive news and bullish stories. There is a buzz around the stock markets and everyone now wants to be a part of the wealth generation opportunities.
With increasing speculative volume and public participation, the time is right for the distribution phase to start.
This is when the smart investors or money starts to move in. The same investors who started accumulating share in the bear market begin to gradually sell or distribute their shares in the market.
Given the positive sentiments and bullish environment investors who had earlier not participated in the market are now keen to buy expecting a further uptrend.
The selling from the institutional investors tends to get absorbed because of the demand from the public which prevents the share prices from falling, thus giving them much needed support. However, at the same time with constant selling at higher levels by the smart investors the movement in share prices tends to get capped creating resistance levels on the upper side.
Finally, when the offloading from the institutional investors is complete share prices start to stagnate. This frustration leads to a sell off in the markets which in turn ushers in another bearish market.
This is also when another accumulation phase starts and the cycle repeats itself.
Tenet 4
Averages (Indices) must confirm each other
What this means is that all the indices in the market should show a similar trend to confirm a bullish or bearish market. For example: if the bellwether Nifty is showing a positive trend while the other indices like the small or mid cap are bearish it cannot confirm a bearing market. Since the Nifty is at divergence and does not confirm the trend.
However, the theory also says that the signal from the indices need not occur simultaneously. But a shorter time between the signals provides a stronger confirmation.
In his theory Dow refers to the industrials and transportation averages for confirmation.
Tenet 5
Volumes must confirm the trend
The Dow theory recognises volumes as an important but secondary factor. For the trend to get confirmed volumes should increase or go up in the direction of the major trend.
In an uptrend or bullish market volumes should increase as price moves higher and decrease as prices fall. Similarly, in a downtrend or bearish market volumes should increase as prices fall and be lower when prices rally or move higher.
Tenet 6
Trend is in effect until there is a clear reversal
This tenet is important as predicting a trend reversal can be a challenging exercise. It can be easy to confuse a secondary trend to be a trend reversal.
In a bullish market a temporary downward move may seem like a trend reversal. But it could just be a secondary trend.
Technical indicators like trendlines, support and resistance levels and moving averages could be useful in spotting reversals.
The theory states that until a new trend is established you have to consider the primary trend.
Conclusion
- Dow theory can help identify the various trend and phases in the market.
- Understanding these phases can prevent going against a particular trend.
- These trends can help keep emotions out of investing.
Frequently Asked Questions (FAQs)
What is the Dow Jones Index and who founded it
Dow Jones Index or the Dow Jones Industrial Average is an index of the 30 prominent companies listed on the stock exchange in the United States.
The index was developed by Charles Dow who was the founder of the Dow Jones Company and also the first editor of the Wall Street Journal through which he educated about the behaviour of the stock market.
What is a Primary Trend
According to the Dow Theory there is an uptrend if each successive rally closes higher than the previous rally. At the same time the lows are higher than every previous low. Which means that each wave that hits the shore in further inland then the previous wave that came in.
If the opposite happens where each successive low is lower than the previous low the market could be headed for a downtrend. Which is saying that each successive wave that comes in is further away from the shore than the previous one.
A pattern of rising peaks and troughs (high and low) is an uptrend while lower peaks and lower troughs and a downtrend.
Primary trends are said to last for more than a year or possibly more.
What is a secondary trend
Secondary trends are corrections within the primary trend moving in the opposite direction. They are shorter compared to the primary trend and can last from around three weeks to three months.
The correction during this phase can be between one-third and two-third of the previous movement. Secondary trend is basically a correction in a bullish market and rallies in a bearish market.
Secondary trends can also be flat and time consuming rather than correcting in price.
What is a minor trend
Minor trends are just referred to as market noise. This trend can be for a few hours to days. They are not considered reliable to track market trend and are mostly fluctuations in the secondary or intermediate trend.
How are volumes important in a trend
According to the Dow theory volumes is an important but secondary factor. For the trend to get confirmed volumes should increase or go up in the direction of the major trend.
In an uptrend or bullish market volumes should increase as price moves higher and decrease as prices fall. Similarly, in a downtrend or bearish market volumes should increase as prices fall and be lower when prices rally or move higher.
Learn about 6 tenets of the Dow Theory for better understanding.


How Would You Rate This Chapter?
Next
Comments (0)