Technical Indicators– A stroll through the market
Technical Indicators are like road signs, too few may not serve the purpose and too many would defeat the purpose and confuse the driver. Only the ones are the right places are needed that warn us of a curve ahead or a crossing ahead to avoid accidents.
It is then upon the driver, in our case, the trader to negotiate his way to profits using these indicators. Use of too many indicators defeats the purpose, as some may cancel each other out while others may all be pointing to the same results.
Rather than look at all the indicators we would look at some of the other important indicators that are widely followed by traders in the market. These are – the Keltner Channels, Parabolic Sar and Rate of Change.
Keltner Channels
Keltner Channels are a lot like Bollinger Bands except that their inputs are different. While the Bollinger Bands use standard deviation data from the average line for the input values, Keltner Channels use the Average True Range as inputs on the average line. Average True Range indicates the range in which the price has moved over a period of time.
Average True Range is indicated either in percentage or absolute terms. Say the Average True Range of Bank Nifty is 600 points for a 20-day period or it can also be represented as 2.5 percent of Bank Nifty price. It would mean that the Bank Nifty moves in a price range of 600 points in the last 20 days or in a range of 2.5 percent.
The general convention is to use two Average True Range values above and below a 20-period exponential moving average.In the case of Bank Nifty, it would mean a range of 1200 points or 5 percent,
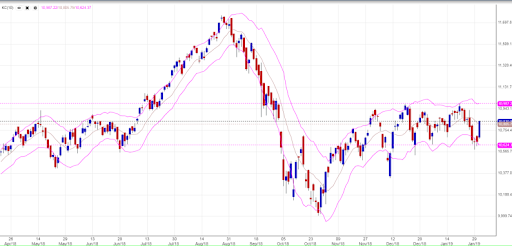
The chart above shows how the Keltner Channels envelopes most of the data points in the chart.
Chester Keltner designed this indicator, which is generally used by traders as a moving support and resistance line. As in the case with Bollinger Bands, these extreme lines are also used as overbought and oversold zones.
A trader can choose the moving average around which he would like to fit the Average True Range. The width of the band can also be changed by varying the multiple of the Average True Range. Most software comes with a default setting of two times, but one can change it to any number that best encompasses the entire chart.
Keltner Trading Strategies
Most strategies that are used by traders using Bollinger Bands are similar to those for Keltner Channels, such as trading on the bands as support and resistance trades. Yet, Keltner Channels are also used as a trend following systems since their primary source of data for creating the channel is the moving average.
One trading strategy that followers of the Keltner Channel generally follow uses a breakout above or below the channel as a change of trend signal.
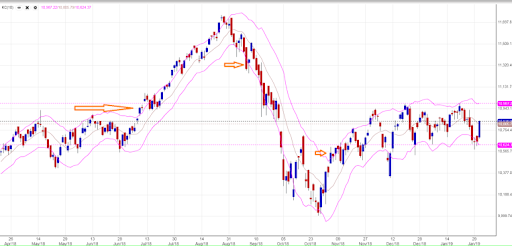
The chart shows the three occasions when the price broke the channel and the price moved in line with the breakout. A trader waits for a rebound and uses the 20-period moving average as a place to enter the trade, offering a good risk-reward.
Parabolic Sar
The Parabolic Stop and Reverse, popularly known as the Parabolic SAR indicator, is a trend following indicator that was developed by J. Weller Wilder, the same person who designed the Relative Strength Index (RSI).
Unlike other indicators that are depicted as lines, the Parabolic Sar is shown as dots on the price chart. As it is a trend following indicator, it highlights the direction of the market.
The chart below shows the Parabolic SAR and how it moves with the market.
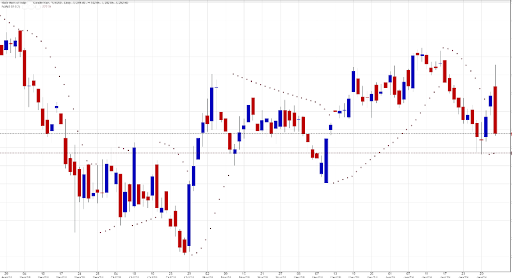
The Parabolic SAR follows the trend and acts as a good entry, stop loss, and exit point.
The dots change direction with the trend and, as they stand away from the price points, they make a clear entry and exit signal. As long as the dots are below the price chart, a trader can stay long in the trend and, in fact, use the low of the price point where the dot is as a stop loss. The same goes for when the stock is falling and the Parabolic SAR is at the top of the price.
The drawback of Parabolic SAR is the same as it is for other trend-following indicators, it goes crazy when the market is range bound. The number of signals it generates during this period questions its utility as it does with another trend following indicators.
Rate of Change
The Rate of Change is a momentum indicator that is more of a calculator of change in price between two dates. Despite the simplicity in the construction of the indicator, it is an important tool in the arsenal of momentum traders.
But first the calculation.
The rate of Change = (Recent price – Price n periods ago)/(Price n periods ago) * 100
The rate of change clearly measures the speed at which the price is moving. Traders variously use the indicator to take advantage of it.
The chart below shows the Rate of Change in the lower end of the graph. The indicator also behaves as an oscillator and traders use it as such.
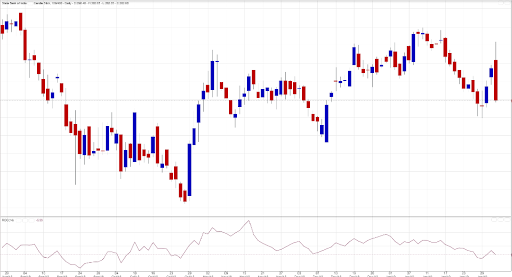
By default, most charting software uses a 14-period Rate of Change, which means that it measures the change of price between the current price with that 14 days ago.
Traders use the Rate of Change crossovers above and below the zero lines to trade. Traders try to optimize this strategy by changing the period of Rate of Change so that it does not generate too many signals or is late to generate a trade.
The Rate of Change is also used as an oscillator with traders using a value of greater than 30 as an overbought and less than negative 30 as an oversold level.
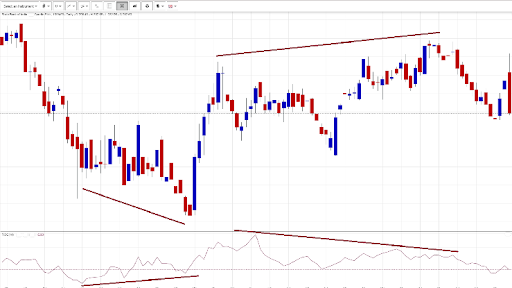
The other common strategy is the divergence between the Rate of change and price. The chart shows how divergence can be used to predict a change in trend.
One of the most popular uses of Rate of Change is to compare prices across stocks based on Rate of Change. Companies with the Highest Rate of Change value indicate that they are the strongest and those with the lowest value indicate they are the weakest. A long-short trader would go long on the strongest share and short on the weakest. Momentum traders would go long on the strongest stocks.
Rate of Change is preferred over Relative Strength Index (RSI) by momentum traders as it is found to be more accurate.
Conclusion:
A trader may use any technical indicator but his success is dependent more on his risk management and money management skills. All technical indicators work only for a certain period of time or certain market conditions. Knowing when to use which indicator and managing size with strict stop losses is the route to success.


How Would You Rate This Chapter?
Next
Comments (0)