Guide to Technical Analysis

There are broadly two disciplines or approaches on which stock market investing is based. They run parallelly like railway tracks, rarely intersect but both essential for the markets to move.
It is said that one helps to know when to buy while the other tells us what to buy.
The two approaches are Technical Analysis and Fundamental analysis.
What is technical analysis?
Technical analysis is a research method or tool which can help predict trading opportunities in the markets based on the action of other market participants. It can be used to predict future movements in the indices or stocks based on past and present market data.
This data is usually plotted on a chart using various technical analysis tools and software. Over a period of time this data reveals various patterns with each of the patterns conveying a certain trend or expected movement.
The validity of technical analysis is that collective actions like buying and selling of market participants reflects and discounts all relevant information to arrive at a fair value to the underlying share or index.
Investors who follow technical analysis as a trading or investment approach identify these patterns and form a view on the markets.
Basic assumptions in technical analysis
There are some core assumptions on which technical analysis is built.
History repeats itself
In the context of the stock market collective memory tends to be remarkably good. Traders in the market react of to price movements in quite a similar way. If the chart shows the stock price trending in a certain way and forms a pattern it has in the past, most participants will contextualise it for past trends and react in a similar way.
Market knows it all
Very rarely is a stock not valued right. This is because all know and unknown news is reflected in the stock price. While the news in public domain is known to all unknown news can reflect in the share price. Lets assume someone is buying a stock on inside news only known to a few. This buying will push up volumes and prices which ultimately reflects in the trend on the charts.
Emphasis on how more than why
A technical analyst is not interested in why the price is going up he largely concentrates on the how. The sudden spurt in volumes could mean that someone has already researched the why.
Trend in price movement
Technical analyst look for trends. Historically, it has been observed that a certain upward or downward trend in the markets is established over a period of time. If the current trend is reflective of a past trend the analyst will play that trend.
Making a chart for technical analysis
Data points
The basic data required to make a chart for technical analysis is the daily Open, High, Low and closing price of a stock and the volumes that have traded in that share.
These data points capture a fair indication of the trend and remove the need for plotting the thousands of price points that the share could have traded in over a certain period.
These data points are simple to understand. Open is the first price the share traded at on a given day. High and low are the highest and lowest price the share traded. Close is perhaps the most significant as it can reflect or form the basis for any future trend. Volume is the total numbers of shares bought and sold in a given time period.
Time frames
The time frame a technical analyst uses to plot the chart depends on his trading horizon. A day trader who essentially opens and closes a position on a daily basis will look at shorter time intervals on the chart to read and establish trends. It could vary from an hourly chart to an intra-day chart or even a daily chart.
On the other hand a long term trader who holds positions over night or for long periods of time will use charts of a longer duration. These could be daily or even weekly charts.
It is important to understand relevance of time frame in technical analysis. A trend established in say an hourly chart can be significant for a day trader who is looking to close his position at the end of the day.
However, that same price movement if looked at over an daily chart or even weekly chart can show a totally different trend which may not be of any help to a long term trader.
Types of charts
There are three types of charts which can be drawn up.
- Line chart
- Bar chart
- Candle stick
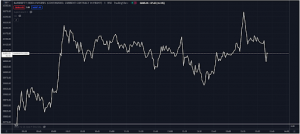
Line chart
The most basic of charts is the Line chart. This chart has limitations as it can be plotted using just one of the parameters we discussed above. A line chart uses just the closing price as opposed to the open, high, low and close. But it is also simple to plot and can give the analyst a view of the trend.
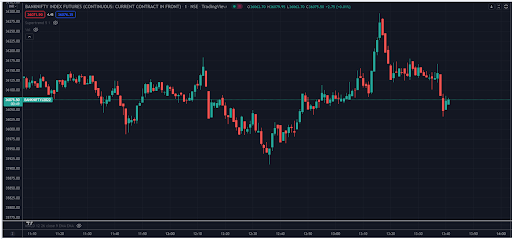
Bar chart
Compared to a line chart a bar chart is much more indicative as it uses all the four parameters needed to plot a chart for technical analysis viz: Open, High, Low and Close.
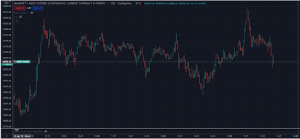
Candlestick
The most widely and commonly used chart is a Candlestick especially among seasoned technical analyst.
This chart has its origin in Japan as hence also know as the Japanese Candle Stick.
Lets spend sometime to understand this charting technique a bit more.
A candlestick is formed based on the price action in any given time frame. An hourly candlestick shows the price movement for one hour while a four hour candlestick will capture the trend during that specific period.
In a candlestick the highest point represents the highest price the stock has traded during the given period and the lowest is the low the stock has hit during that time frame.
The body of the candlestick or the thicker part of the candlestick indicates the opening and closing price for the given period.
While some software’s have default colours for bullish and bearish candlesticks it is also customised as per the technical analyst preference.
Bullish candle
If the close is higher than the open the candle is bullish
Bearish Candle
If the close is lower than the open it is a bearish candle.
The benefit of using candlestick is that visually it provides a easier way of determining whether the share price closed higher or lower over a given time frame. Visual cues and patterns can be better understood.
Technical Indicators
The different types of charts and formations available to technical analyst are complimented by various technical indicators that traders use to make decisions.
Moving averages
Moving averages are indicators used to identify an ongoing trend. Some of the popular moving averages are the 10, 20, 50, 100 and 200 day moving averages.
There are three types of moving averages Simple Moving Average (SMA), Exponential Moving Average (EMA) and Weighted Moving Average (WMA).
If the price moves above a moving average then the trend is considered to bullish and reversely bearish if the price moves below the moving average.
The higher the number the greater is the significance of the trend.
Moving Average Convergence and Divergence (MACD)
MACD is a trend identifying indicator which shows if a trend will continue or there will be a reversal. This indicator has two lines the MACD line and the signal line. If the MACD crosses the signal line from below it is a buy signal. If the line crosses from above it is a sell signal.
Relative Strength Indicator (RSI)
RSI is a momentum oscillator which measures the change in recent prices and is a leading indicator which helps in identifying a trend reversal.
The RSI oscillates between a range of 0 to 100. If the RSI is between 30 and 0 it is in the oversold zone and indicates an upward movement. When the RSI is between 70 and 100 the share is in the overbought zone and susceptible to a downward correction.
Fibonacci Retracement
Fibonacci ratios were developed by a 12th century mathematician and are used to identify trading opportunities.
The retracement levels are horizontal lines which indicate support and resistance levels based on these ratios.
The Fibonacci retracement levels are Fibonacci ratios such as 23.6%, 38.2%, 61.8%, and 78.6%.
These are just some of the multiple indicators used by technical traders to form a view on the markets. However, no indicator is perfect. Mastering each indicator and its understanding over a period of time will lead to a better outcome.
Advantages and Disadvantages of technical analysis.
There are those who swear by technical analysis and those who do not trust it. It is not easy to pass judgement if it works or doesn’t. But yes it does have its advantages and disadvantages
Advantageous
Less Time
Users of technical analysis believe that since all the relevant information is already priced into the stock one can identify trading opportunities quicker. Which means that instead of spending time on the irrelevant information more time can be spent studying the price and market movements.
Ready Resources
Charting tools and software are easily available there is also a lot of research on all the indicators used in technical analysis. As such there is no need to reinvent the wheel.
Any market or time frame
Once you understand technical analysis unlike fundamental analysis it can be applied to shares, forex, metals among a host of other investment avenues. Its premise remains the same trend tend to repeat themselves and patterns are an indicator of what the future outcome can be.
Disadvantages
Invalid over the long term
Technical analysis can be for more successful in predicting short term trading opportunities. Over the long term there are various economic and political factors that determine the trend in markets.
Not easy to master
Becoming adept at technical analysis requires a lot of study and to be able to identify and implement trading strategies based on the indicators available. Half knowledge in technical analysis can be detrimental.
Difference between Technical Analysis and Fundamental Analysis
At the beginning we had identified two approaches which are like two rails on which stock market investing runs. We have seen what technical analysis is all about.
Now lets run through the difference between technical analysis and fundamental analysis.
But first what is fundamental analysis
Fundamental analysis is studying a company and business from top to bottom to arrive at an investment decision. It is more long term in nature. Fundamental analysis looks at the company’s financials and future growth prospects. It involves studying the company’s balance sheet and profit and loss statements. And also comparing how its financial ratios stack up against its peers.
Technical Analysis vs Fundamental Analysis
- Fundamental analysis is used to evaluate the intrinsic value of a particular stock, whereas technical analysis is used to predict future price trends.
- Technical analysis is used more for short trading while fundamental analysis is more from a long term investment perspective.
- Technical analysis is done using price movements and patterns on charts. Fundamental analysis takes into account a company’s financials.
- Fundamental analysis looks at both past and present data. It also forecast future data. Technical analysis largely relies on past data of stock prices.
- Fundamental analysis is used to identify the intrinsic value of a stock. Technical analysis is used to identify the perfect entry and exit points in a trade.
Conclusion
- Technical Analysis is a representation of the action in the market on a chart.
- It can help identify entry and exit points in an investment.
- Technical analysis is more short term or a traders way of playing the market.
- The tools of technical analysis can be applied across different asset classes
Frequently Asked Questions (FAQs)
What is Technical Analysis
Technical analysis is a method or tool which can help identify trading opportunities in the markets based on the action of other market participants. It can be used to predict future movements in the indices or stocks based on past and present market data.
This data is usually plotted on a chart using various technical analysis tools and software. Over a period of time this data reveals various patterns with each of the patterns conveying a certain trend or expected movement.
The validity of technical analysis is that collective actions like buying and selling of market participants reflects and discounts all relevant information to arrive at a fair value to the underlying share or index.
What are the most common types of charts in the market?
The three most common types of charts used are Line charts, Bar charts and Candle stick charts. While line charts are based on only one value, that is normally the closing price of the period the other two charts use four data points – Open, High, Low and Close of that time frame.
Charts can be drawn on any time frame and their interpretation is generally the same irrespective of the timeframe they are viewed on.
What are technical indicators?
Technical indicators are tool that normally use price as the data point on which they are designed. Technical indicators normally lag prices but there are some that pre-empt a price move.
Introduction to the basics of technical analysis of stock market.


How Would You Rate This Chapter?
Next
Comments (0)