What are Candlesticks? – Types, Charts & Patterns
Japanese Candlesticks
Apart from naturally occurring elements, there are very few products in the world that has stood the test of time. This is especially true in the financial world.
Yet there is one tool that has been around and in fact, has gain acceptance thanks to technology for the last 400 years. It is Japanese Candlesticks.
Used primarily by rice traders to note rice prices and trade it, candlesticks have gained popularity in the western world and in India ever since Steve Nison wrote a book in English on the candlesticks.
Introduction to Candlesticks
Like Bar Charts candlesticks also give the same data points – open, high, low and close of any time frame selected by the trader. However, the way it is presented is what makes the difference.
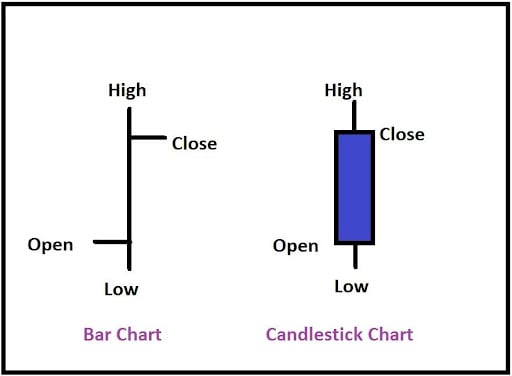
The above diagram compares represent the same four data points on a bar chart and candlestick chart.
The body of a candle by its very shape shows the strength of the move. The bar chart does not have the ‘emotion’ that is visually appealing.
A common feature between bar and candlesticks is that both change colours depending on the relationship between the opening price and closing price.
If the closing price is above the opening price then it is a bullish bar or candle and will be represented in most trading software as a white, green or blue bar or candle. One the other hand if the closing price is below the opening price then it is considered to be bearish and the bar or candle is represented by black or red bar or candle.
The diagram below shows the bullish and bearish candle. (Note we will represent a bullish candle in blue and a bearish candle in red).
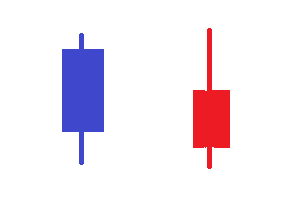
In the case where the body of the candle is red or is a bearish candle – the close is always below the open while in the case where the body is blue candle the open in below the close.
The two lines extending above and below the body of the candles are called the wick or shadow. The highest point of the top wick is the high made by the candle and the lowest part of the lower wick is the low it makes.
Types of candles
The Japanese traders had a name for almost all type of candles, depending on the colour and shape of the body. There are names for a single candle, a two candle formation or a three candle formation.
Most meaningful and tradable candles that offer a good risk reward are the ones that appear at the tops and bottom. Also, at every top and bottom there is mostly some kind of candle pattern.
Marubozu
When a candle has no shadows or wicks it is called a Marubozu. The word Marubozu means shaven head. The candles are powerful since in case of a bull Marubozu the bulls were in complete control throughout the session and in the case of a bear Marubozu the bears were in control throughout.
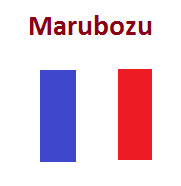
These candles however, are very rare in the higher timeframe, unless it is followed by extreme news flows.
Doji
This is the only type where the candle and bar look the same, since the opening and the closing price is at the same level. However, the Japanese gave importance to place where the opening and closing occurred.
A Doji occurs when the open and close are at the same or nearly the same level.
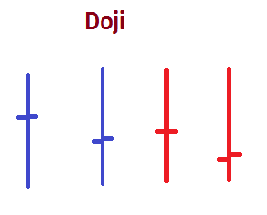
A Doji symbolises a zone where the bulls and bears were present in equal strength. This also means that the preceding trend is over and either a new one will start or the market could go sideways.
Dragonfly and Gravestone Doji
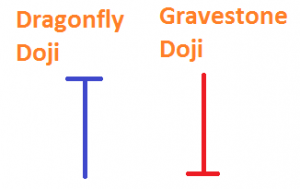
A Dragonfly Doji is ‘T’ shaped where three data points coincide – open, high and close. This candle does not have any shadow or wick on the top. The position of the Dragonfly Doji with respective to the preceding trend is important.
If it occurs after a fall, the Dragonfly Doji suggests that buyers are now gaining strength and have pushed the bears against the wall.
But if it occurs after a rising preceding trend then it signifies that though the bulls have won the day, there are enough bears lurking around. The next few days will be important in such a case.
A Gravestone Doji is exactly opposite in shape as well as inference. In this case, the open, low and close are at the same point.
If the Gravestone Doji occurs after a steady rise it signals that bears are gaining the upper hand and chances are that the rising trend is over. If it occurs after a fall it signals that the bulls are regrouping and were able to push through the bear’s defenses.
While the Doji in itself is a good enough indicator, its positioning with respect to the previous candle is also a significant signal.
Harami Pattern
The Doji is more powerful in its meaning if it is positioned within the high and low of the previous body. As seen in the diagram below the Doji candle is within the previous candle. In Japanese Candlesticks, it is a Harami Pattern. Harami in Japanese stands for a pregnant woman.
The smaller candle in a Harami pattern need not be a Doji, but since the smaller candle is so small the open and close are very near each other.
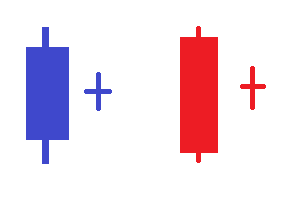
The appearance of the Harami pattern signifies the end of the trend. If it appears after a bullish candle it means that the bulls do not have enough strength of even taking the price above its previous high. The same inference can be made when the Doji appears within a red candle. The bears are tiring and are unable to push prices lower.
However, if the market is moving in a small range appearance of a Doji has little significance. Its importance is felt when it appears after a trend.
Single Candle Patterns
Hammer and Hanging Man
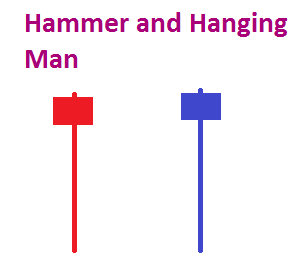
The diagram shows two images which are similar in shape and size but are of different colours. The colours are not important but the position of where they appear on the chart is what determines their name.
If the candle appears after a fall it is called a Hammer. The bulls have regained power finally after a series of bearish candles and have ‘hammered’ their way to the top. Even if the price does not rise in the following candles the Hammer symbolises an end of the previous trend. Importantly, if the Hammer appears on the correction of a bull run it is a very strong signal to go long.
If on the other hand, the same candle appears at the top of a rising trend it gives a weak signal. The candle is now called a ‘Hanging Man’.
Note the location of the Hammer and the Hanging man in the chart below.
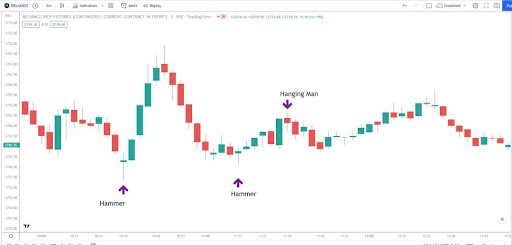
It signifies that the bears are back in town and have been able to push prices lower as can be seen from the long lower shadow. Though the bulls have been able to push the market higher, chances are that the market may fall leaving some men ‘Hanging’.
Inverted Hammer and Shooting Star
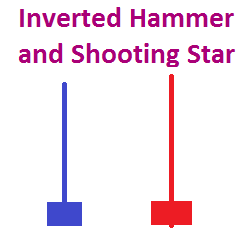
In these candles too, though they look exactly the same, their name is defined by their position rather than their colour.
If the bar appears on the top of a rising chart pattern it suggests a weakening of bull strength. The bears are gaining and may push the prices lower. In such a case the candle is identified as a ‘Shooting Star’. A Shooting Star is a very strong signal if it appears at the top of a correction in a downtrend.
If however, the bar appears after prices have been falling it signifies that the bulls are able to punch a hole in the bear raid, given the long upper shadow of the candle. The candle which now identified as an ‘Inverted Hammer’ is a bullish signal. Even if price may not rise immediately the speed of fall is likely to recede.
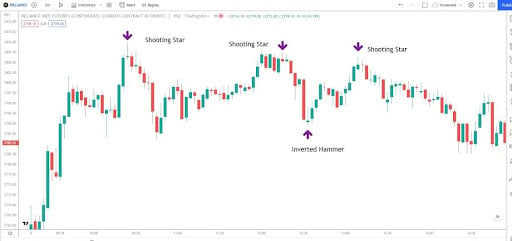
The chart below shows the significance of these candlestick patterns.
Two Candle Patterns
Engulfing Pattern
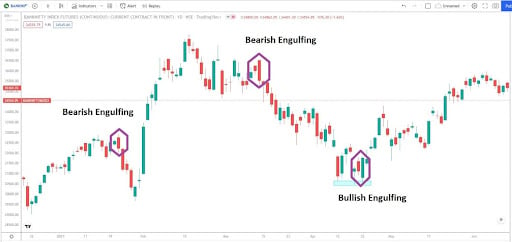
It is a two candle pattern which signals a change of trend. Engulfing Patterns are found at the end of a rally or a correction. It is a powerful signal where the second candle completely embraces the previous candle.
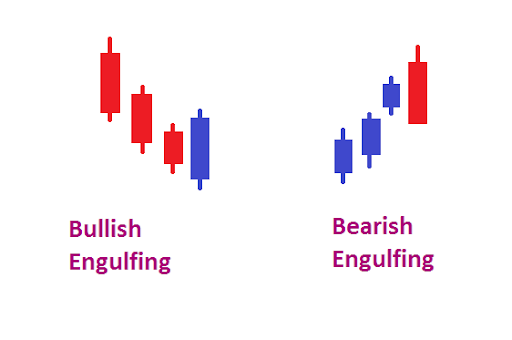
If the second candle is a bullish candle that ‘engulfs’ the previous bearish candle it is a Bullish Engulfing pattern. The pattern has more significance if it appears after a fall in prices. A bullish engulfing pattern appears after prices have fallen.
In case the second candle is a bearish candle which ‘engulfs’ the previous bullish candle that is formed after a run-up in prices it is a signal that prices may fall. This pattern is called a Bearish Engulfing Pattern. A bearish engulfing pattern appears after a rise in prices and is close to the top of the move.
It is important that the body of the previous candle is engulfed and not the entire candle. If prices are in a tight range, appearance of both the Engulfing patterns is meaningless.
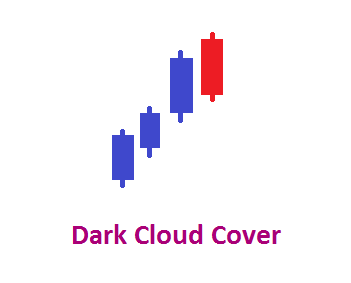
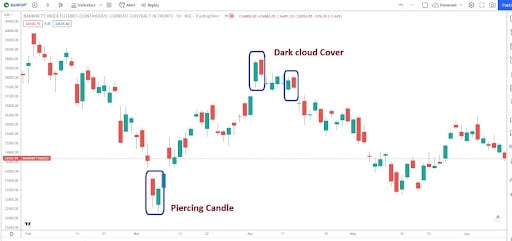
Dark Cloud Cover and Piercing Pattern
This is also a two candle signal but bearish in nature. Here the second candle is a bearish candle that partly covers the bullish candle preceding it. Analysts generally would want to see the second candle to cover over 50 percent of the previous bullish candle.
Another important point to note here is that the second candle should open higher than the high of the previous candle, suggesting that the bulls came to the battle with plans to take the market higher but were beaten by the bears.
This candle gives a strong continuation signal in a falling market when it appears after a small correction in prices.
Opposite to the Dark Cloud Cover pattern is the piercing pattern. They appear after a fall in prices and have a bullish significance
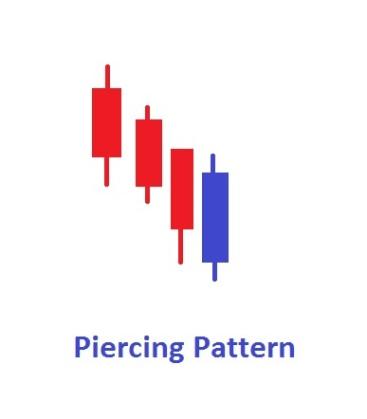
In this case the first candle is bearish or red in colour and the second opens lower but closes near the high of the period. It is important for this candle to cover more than 50 percent of the previous red candle.
Three Candle Pattern
The most common of patterns that traders follow are the Morning Star and Evening Star.
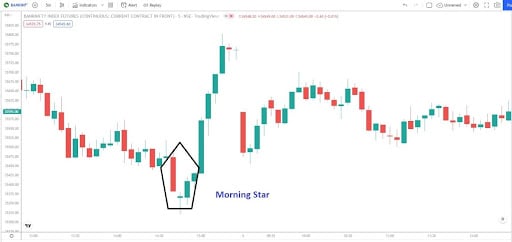
Morning Star
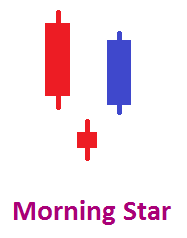
This three candle pattern is generally found at the bottom of a fall in prices. A long bearish candle is followed by a small candle, which can be a bearish, bullish or a Doji candle. The important thing is the third candle has to be bullish candle to confirm a change of direction.
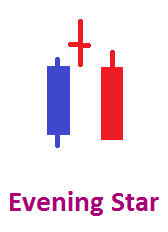
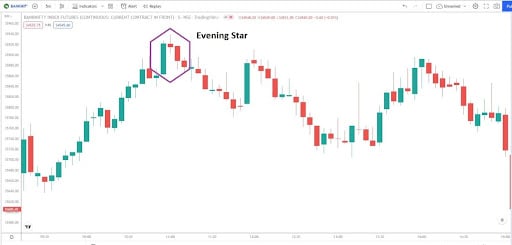
Evening Star
Unlike the Morning Star which suggests a reversal for a rise in price, an Evening Star suggests a reversal for a fall in prices.
This three candle formation is found at the top of a price run where the first candle has to be the bullish candle, the second candle can be a Doji, bullish or bearish but the third candle has to be bearish candle.
Conclusion
Candlestick have gained popularity on account of their simplicity and also because they are generally found at the turning points. Because of their locations, they generally offer a good risk reward trade. Easy to learn, understand and trade candlestick is the most preferred chart type for traders.


How Would You Rate This Chapter?
Next
Comments (0)