MACD Indicator
Imagine two windmills at different heights. Normally, the taller windmill will be more active than the lower one, as wind velocity is more as we move higher.
A weatherman is tracking both the windmills to give an early warning signal if a storm is approaching. This weatherman knows that if the higher windmill moves above a particular speed, then the chances of a storm are higher. But the problem is that the taller windmill often gives this signal which has proved to be wrong and the weatherman has been criticized for giving out wrong signals.
The weatherman has a brainwave and then decided to install the second windmill. It is only when both the windmills move above a certain does he now raise the alarm. But every time the taller one moves above the safety limit, he raises a yellow flag signaling that citizens need to be careful as a storm might be approaching. The weatherman’s foresight helped save many lives in his small village by the sea.
What if we had a similar weatherman in the market who would tell us if the market or stock is going to go higher or move lower?
Fortunately, we do. This weatherman, which is a technical indicator, even raises a yellow flag that a turn might be approaching going forward. Moving Average Convergence Divergence (MACD) is one such indicator that has been right than wrong.
What is a MACD?
Though it has the functionality of an oscillator as it sways between two extremes, but unlike an oscillator, it has no defined boundary.
Gerald Appel developed this indicator in 1960, which has been used by traders to spot momentum much before it showed up on other indicators.
MACD is actually a trend and momentum indicator but, like a dashboard on a car, gives away many signals, all of which point to the possibility of an important event in the market. But before looking at the signal generated by MACD, we first need to understand the construction of MACD.
Construction of MACD
The beauty of MACD is the simplicity of its construct. The MACD (pronounced as Mac Dee) turns two moving averages into a momentum/trend following indicator by subtracting the value of the smaller exponential moving average from the larger one.
The default values of the small and large moving averages are 12 and 26. In order for it to generate trading signals, a 9-period exponential moving average is added which takes its value from the subtract for 12 and 26 moving averages.
At the point where the two moving averages meet the value of the MACD line is zero. The MACD moves above and below the zero line as the moving averages converge and diverge.
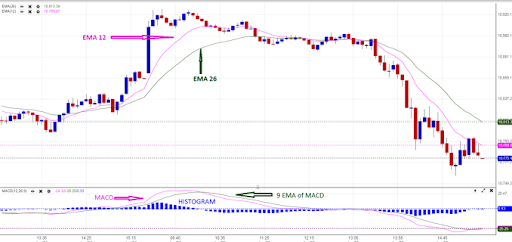
The diagram below shows the MACD line and the 9-period exponential moving average, below the price chart. The chart also shows a histogram. The histogram is plotted by taking the difference between the MACD and the 9-period exponential moving average. The histogram can be called the MACD of MACD.
For traders who follow the moving average, the MACD offers a good alternative. Note the point where the crossovers take place in the moving averages and in the MACD, see the chart below.
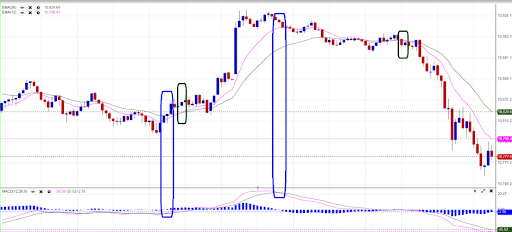
The blue boxes correspond to the point where the MACD crosses its moving average and the green boxes are the areas where the moving averages cross each other. As seen, the MACD crossover is much ahead of the moving average crossover.
Coming to the weatherman example, the MACD raises the yellow flag which hints at a change down the road. The final confirmation comes when the moving average crosses over.
Also, notice the histogram, which flirts with the zero lines moving above and below it every time the MACD crosses its moving average. This crossover corresponds to the point where the MACD and its average cut.
The MACD, along with its paraphernalia, offers multiple signals to a trader as against a conventional moving average.
The biggest problem with the MACD indicator is that it does not work in a flat market like most other indicators. As is the case with all trends and momentum indicators, the flat market confuses the indicators and it gives repeated buy and sell indicators.
MACD can also be worked along with other indicators or price action or candlestick patterns as a confirmatory signal.
Trading Strategies with MACD
The various indicators that come along with MACD make it a very popular trading tool with traders, as it can give a number of meaningful signals.
MACD crossover
One of the most basic strategies is the crossover of the MACD line above and below the zero lines. More than an entry signal, traders use it as a directional indicator. Every time the MACD line is above the zero line, the trader will not take a short position on the counter. Similarly, every time the MACD is below the zero line, one does not take a long position in the stock.
The chart below shows the change in trend when MACD crossovers the zero line either from positive to negative values or vice versa. The further above the MACD is from the zero lines, the trend is strongly bullish.
MACD and average crossover
MACD and the average crossover is a popular strategy used by trend and momentum traders. As mentioned earlier, these crossovers give a buy and sell much before the moving average crossovers.
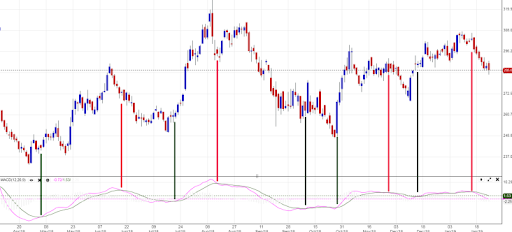
In the chart below the green line indicate the point where the MACD cut the average line from below giving a buy signal. The red line indicates a crossover where the MACD cuts the average from the top, suggesting a sell signal.
As can be seen, the indicators give an early signal and in most cases, work well. In a few cases where the market is in a narrow range, it gives whipsaws.
MACD and Price Divergence
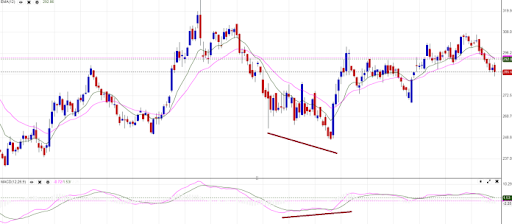
Most oscillators exhibit this property of giving a buy and signal when their movement is in divergence with the price of the underlying. In the case of MACD too, if there is a divergence in the trend of price and MACD, it generally suggests a change in trend.
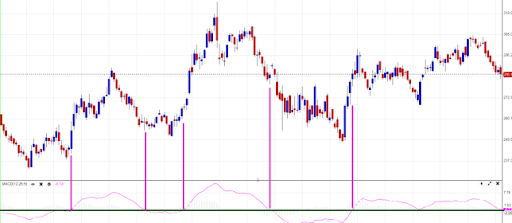
The chart below shows that the price continues to fall, but the MACD has made a higher bottom. The price rebounds and does not even come back to test the previous low.
Histogram and Price divergence
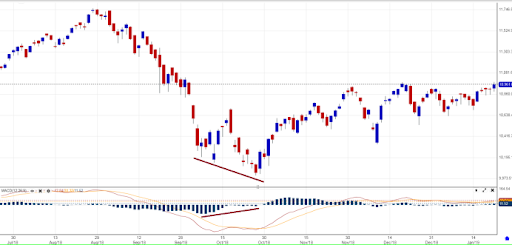
The histogram also plays an important role in giving a trading signal. The most common is the divergence in price and the histogram peaks.
In the chart below, price continues to fall, but the histogram has shown a sharp increase. The fall in price soon stops, and the market bounces back without testing the lows.
Conclusion
MACD is a very important tool to have in your trading arsenal. It is one of the few indicators that give the best of two worlds–a trend as well as momentum. For a trader, this indicator can yield results fast. But like all indicators, it may not be always right. With proper risk and money management, a trader can live happily using this indicator alone.


How Would You Rate This Chapter?
Next
Comments (0)