Bar Charts in Technical Analysis

Bar Charts are used in technical analysis to analyse and understand price movements. Learn how to read bar charts along with their patterns at TradeSmart.

Reading a Bar Chart
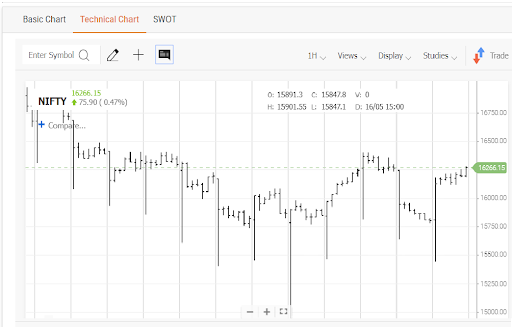
The opening price is shown as a left horizontal line, which is the price at the start of the time period. The closing price, which is the last price for the period, is shown as a right horizontal line.
These lines are sometimes also known as an opening foot—facing left—and a closing foot—facing right. Additionally, they are also called tick marks.
The high price is marked at the top of the bar and the low price is depicted at the bottom of the bar.
The period of the bar chart depends on the purpose they are used for and the preference of the technical analyst.
Daily bar charts are commonly used, where the opening and closing prices are the prices of the stock when the market opens and the price at the close.
Similarly, the high price is the highest price the stock has traded during the day, and the low price is the lowest price of the day.
Direction and Range
The opening and closing lines depict the direction of the price movement during the bar or the period.
If the closing line is above the opening line, then the price movement has been upwards. If the closing line is below the opening line, then the price made downward progress during the bar.
The range of the bar is marked by the top and bottom of the vertical bar. The range is calculated by subtracting the low from the high
Range = High – Low
Volatility
The bar can also show the volatility of the stock over a given period represented by the change between the period high and the period low.
The volatility can be calculated by taking the period high and subtracting the period low.
If the price difference between the period high and low is considerable, the stock could be termed as volatile. Conversely, if the period high and the period low are close together, the security would be considered relatively less volatile.
Bar Patterns
Up-days and Down-Days
To identify patterns effectively the bars should be viewed over a period of time to forecast price movements.
In a simple comparison, the bars should be viewed for two consecutive days. The closing price is considered an important indicator or price.
If the closing price is higher than the day before then it is an up-day. Similarly, a down-day is when the close is lower than the previous close.
Generally, higher closes imply a bullish market sentiment whereas lower closes indicate bearish market sentiment.
The stock could be said to be in an uptrend when there are a series of up-days and the price highs are mostly higher than the day before and the lows are also higher compared to previous lows.
These higher highs and higher lows and closes confirm an uptrend.
Conversely, a downtrend is an opposite pattern where highs, lows, and closes are usually lower on successive down-days.
Continuous pattern
A trend is said to be confirmed when most of the bars show three factors higher closes, higher highs, and higher lows. This is in case of an uptrend.
For a downtrend, most of the bars should have lower closes, lower highs, and lower lows.
This is also known as a continuation pattern if the three factors mentioned above are satisfied.
A continuation pattern indicates that there is a possibility that the trend will continue rather than a trend reversal.
However, if there are no clear signs of a continuous pattern the prices could start to trend sideways or may mark the beginning of a reversal pattern.
A reversal pattern is the turning point of an existing trend and could signal an uptrend or downtrend as the case may be.
Inside Days and Outside days
The daily trading range is another important factor which is measured by the height of the bar.
If the bars are short with a small difference between the daily high and the daily low, it indicates an indecisive market.
This pattern forms an inside day, where the low is higher than the previous low but the high is lower than the previous high.
Long bars are formed when the difference between the high and low for the day are fairly large. This larger range could be an indication of a change in the trend. Long bars often form an outside day, where the low is higher than the previous high.
Spikes
Spikes in the stock price form a long bar and indicate a large daily trading range. It usually indicates a lot of buying and selling action in the stock at various price points.
Spikes in the share price can occur when there is some news flow that induces the movement.
Spikes could lead to a reversal depending on what pattern the stock was forming and the news flow.
If the reason for the spike is not clear then the closing prices can be used as an indicator of the impending sentiment.
Gaps
A gap in a bar is a period where no trading activity has taken place at any price except the high and low.
A stock is said to have a gap-up opening when the current low is higher than the high of the previous bar.
A gap down means that the high of the current bar is lower than the low of the previous bar.
Gaps most appear at the open when the opening price is not within the daily trading range of the previous day.
- Breakaway Gap – can occur after a price consolidation or against the general trend direction. A breakaway gap signals the start of a new directional move either up or down.
- A runaway gap is similar to a breakaway gap, but a runaway gap can extend a trend rather than start a new trend.
- Exhaustion gaps occur at the end of a trend and are with low trading volumes. They can signal a reversal.
Conclusion
Bar Charts are one of the simplest tools in technical analysis. However, they are not decisive in themselves. Bar Charts are best used in conjunction with other indicators to substantiate any trading decision


How Would You Rate This Chapter?
Next
Comments (0)