Have you ever wondered how those squiggly lines on stock charts can hold clues about future price movements? Technical analysis, which involves valuing stocks by interpreting these charts, also encompasses analyzing the morning star pattern or morning star candlestick pattern. This beginner-friendly pattern signals a possible shift from a downtrend to an uptrend, giving you valuable insight for your trading journey. In this guide, we’ll break down the anatomy of the morning star pattern. Understanding this will help you spot it on charts and potentially improve your trading decisions.
What Is a Morning Star Candlestick Pattern?
A morning star candlestick pattern is a three-candle bullish reversal pattern as identified in technical analysis. It appears after a downtrend, signaling a potential shift towards an uptrend. The morning star pattern intrigues traders by hinting at a possible shift in momentum after a downtrend.
Candle 1 (Bearish Engulfing): A large black or red candlestick with a significant body and high close relative to the prior period. This confirms the continuation of the prevailing downtrend.
Candle 2 (Doji or Star Doji): A smaller-bodied candlestick, ideally with long wicks extending both above and below the opening/closing price. This signifies indecision and potential exhaustion in the downtrend as buying pressure begins to emerge.
Candle 3 (Bullish Engulfing): A large white or green candlestick with a substantial body and close significantly higher than the prior period’s close. This signifies a surge in buying pressure, potentially reversing the downtrend and marking the beginning of an uptrend.
While the morning star pattern doesn’t guarantee a trend reversal, it suggests a potential power struggle between sellers and buyers. The emergence of strong buying pressure in the third candle indicates the possibility of a shift in market psychology, leading to a potential uptrend. Interestingly, this apparent shift from black candles to a white candle, resembling the first glimmer of dawn, is how the morning star pattern gets its name.
How to Identify a Morning Star Pattern?
The morning star pattern brings hope for traders seeking a potential trend reversal after a downtrend. Here’s how to identify it on your charts:
1. Market Decline: Look for a chart with a clear downtrend established by a series of lower lows and lower highs. This confirms the bears are in control.
2.Day 1 (P1): A lengthy red candle forms, indicating strong selling pressure. This reinforces the downtrend and sets the stage for the potential reversal.
3. Day 2 (P2): A gap-down opening appears, suggesting the bears are doubling down on their short positions. However, this initial selling pressure is met with hesitation. The resulting candle is a Doji or a spinning top, reflecting indecision and a potential shift in sentiment.
4. Bearish Agitation: The Doji or spinning top on P2 creates a wrinkle in the bearish plan. The expected strong down day doesn’t materialise, hinting at a possible power struggle between sellers and buyers.
5. Day 3 (P3): This is where the bulls take charge. The market opens with a gap up, signifying a surge in buying pressure that quickly overcomes the bears. The resulting candle is a strong blue candle, ideally engulfing the body of the red candle on P1. This engulfing action emphasises the dominance of the buyers.
While the morning star suggests a potential trend reversal, it’s not a guaranteed signal. Here are some additional points to consider:
- Bullish Engulfing Potential: If day 2’s Doji weren’t present, candles P1 and P3 would form a bullish engulfing pattern, a stronger reversal signal.
- Confirmation: While P3 offers early entry opportunities, some traders prefer confirmation from the fourth day showing continued buying pressure.
- Support Levels: Look for the morning star pattern forming near support levels. This strengthens the reversal signal.
By following these steps and considering additional factors, you can improve your ability to identify and potentially profit from morning star patterns in your trading strategy.
What Does a Morning Star Pattern Tell?
Here are some pointers to analyse the morning star candlestick pattern and understand the psychology behind it:
- Downtrend Confirmation (Day 1): The large red candle on Day 1 (P1) solidifies the downtrend and reflects strong selling pressure. This reinforces the dominance of bears in the market.
- Bearish Exhaustion (Day 2): The Doji or spinning top on Day 2 (P2) signifies a potential turning point. The initial gap down suggests continued bearish aggression, but the indecisive candle with long wicks indicates hesitation and possible exhaustion among sellers. This could be due to factors like reaching a support level, profit-taking by existing bears, or emerging bullish news.
- Bullish Takeover (Day 3): The gap up opening on Day 3 (P3) demonstrates a significant shift in power. Bulls are aggressively entering the market, overwhelming any remaining selling pressure. The strong blue candle engulfing the previous day’s body emphasizes this dominance. This could be due to positive news, new buyers entering the market, or a short squeeze.
Beyond the Basic Pattern
- Size and Placement: Ideally, the candles should have a significant body size, particularly the bullish engulfing candle on Day 3. A larger engulfing action suggests a stronger reversal signal.
- Volume: Look for increasing volume on Day 3, especially during the surge that creates the bullish candle. Higher volume confirms the buying pressure behind the price movement.
- Confirmation: While the morning star suggests a reversal, some traders prefer confirmation from Day 4 (P4). Ideally, P4 should be another bullish candle or at least hold above the close of P3, indicating sustained buying pressure.
Combining the Morning Star with Other Indicators
- Relative Strength Index (RSI): The RSI is a momentum indicator. If the RSI is nearing oversold territory (below 30) on Day 1 or Day 2, it adds confluence to the potential reversal signalled by the morning star.
- Moving Average Convergence Divergence (MACD): A bullish crossover on the MACD histogram around the time of the morning star pattern strengthens the reversal signal.
Remember that technical analysis is not an exact science, and the morning star pattern is just one tool in a trader’s arsenal. By understanding the psychology behind the pattern, considering additional factors like size, volume, and confirmation, and combining it with other indicators, traders can improve their ability to identify and potentially profit from this reversal signal.
How Reliable is a Morning Star Pattern?
The reliability of the morning star pattern is a complex issue. Here’s why:
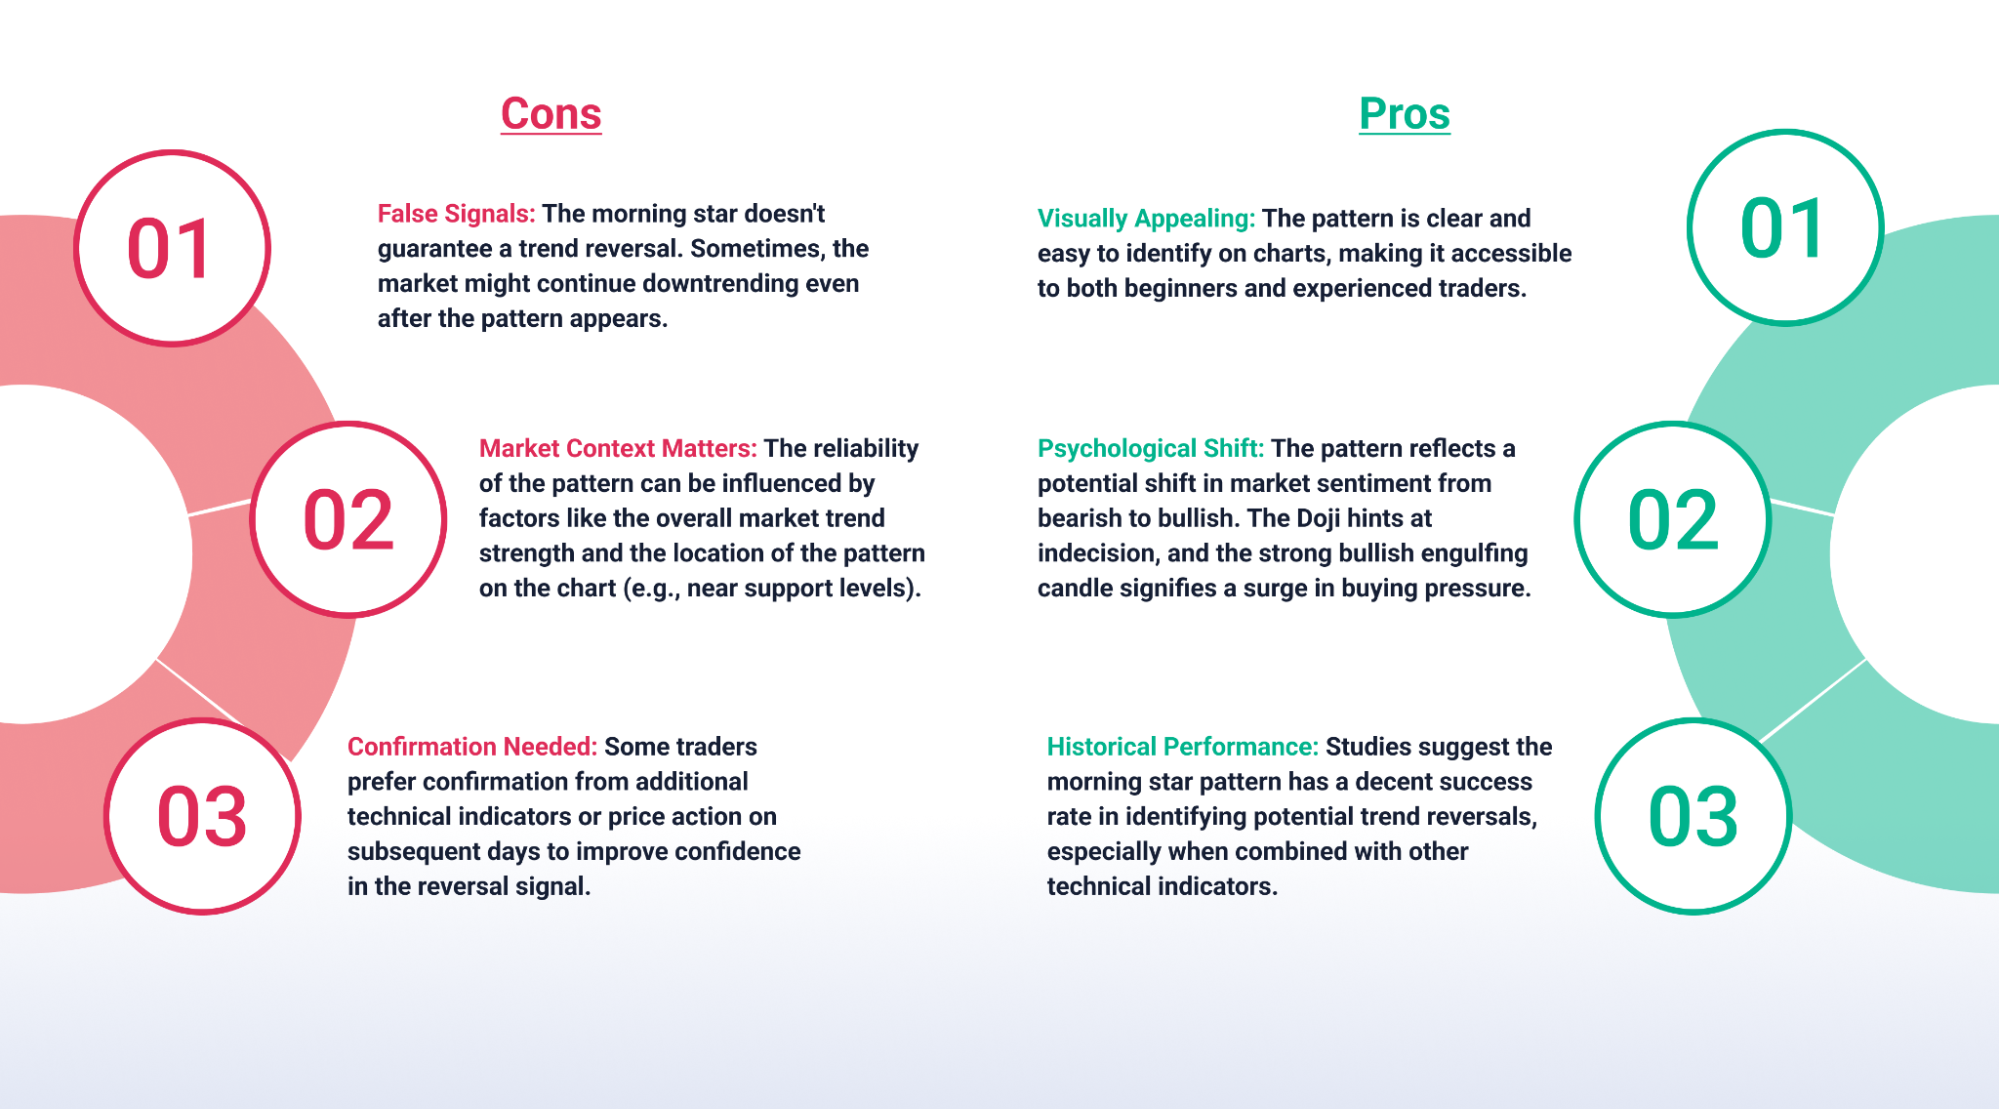
The morning star pattern is a valuable tool for traders, but it should be used with caution. Here are some tips to improve its reliability:
- Combine with Other Indicators: Use the morning star in conjunction with other technical indicators like RSI or MACD for confirmation.
- Consider Market Context: Look for the pattern near support levels or during periods of weak downtrends for a stronger reversal signal.
- Confirmation from Additional Price Action: Observe price action on subsequent days. Ideally, you want to see continued buying pressure to strengthen the reversal signal.
By understanding the limitations and using them strategically, the morning star pattern can be a helpful addition to your technical analysis toolbox.
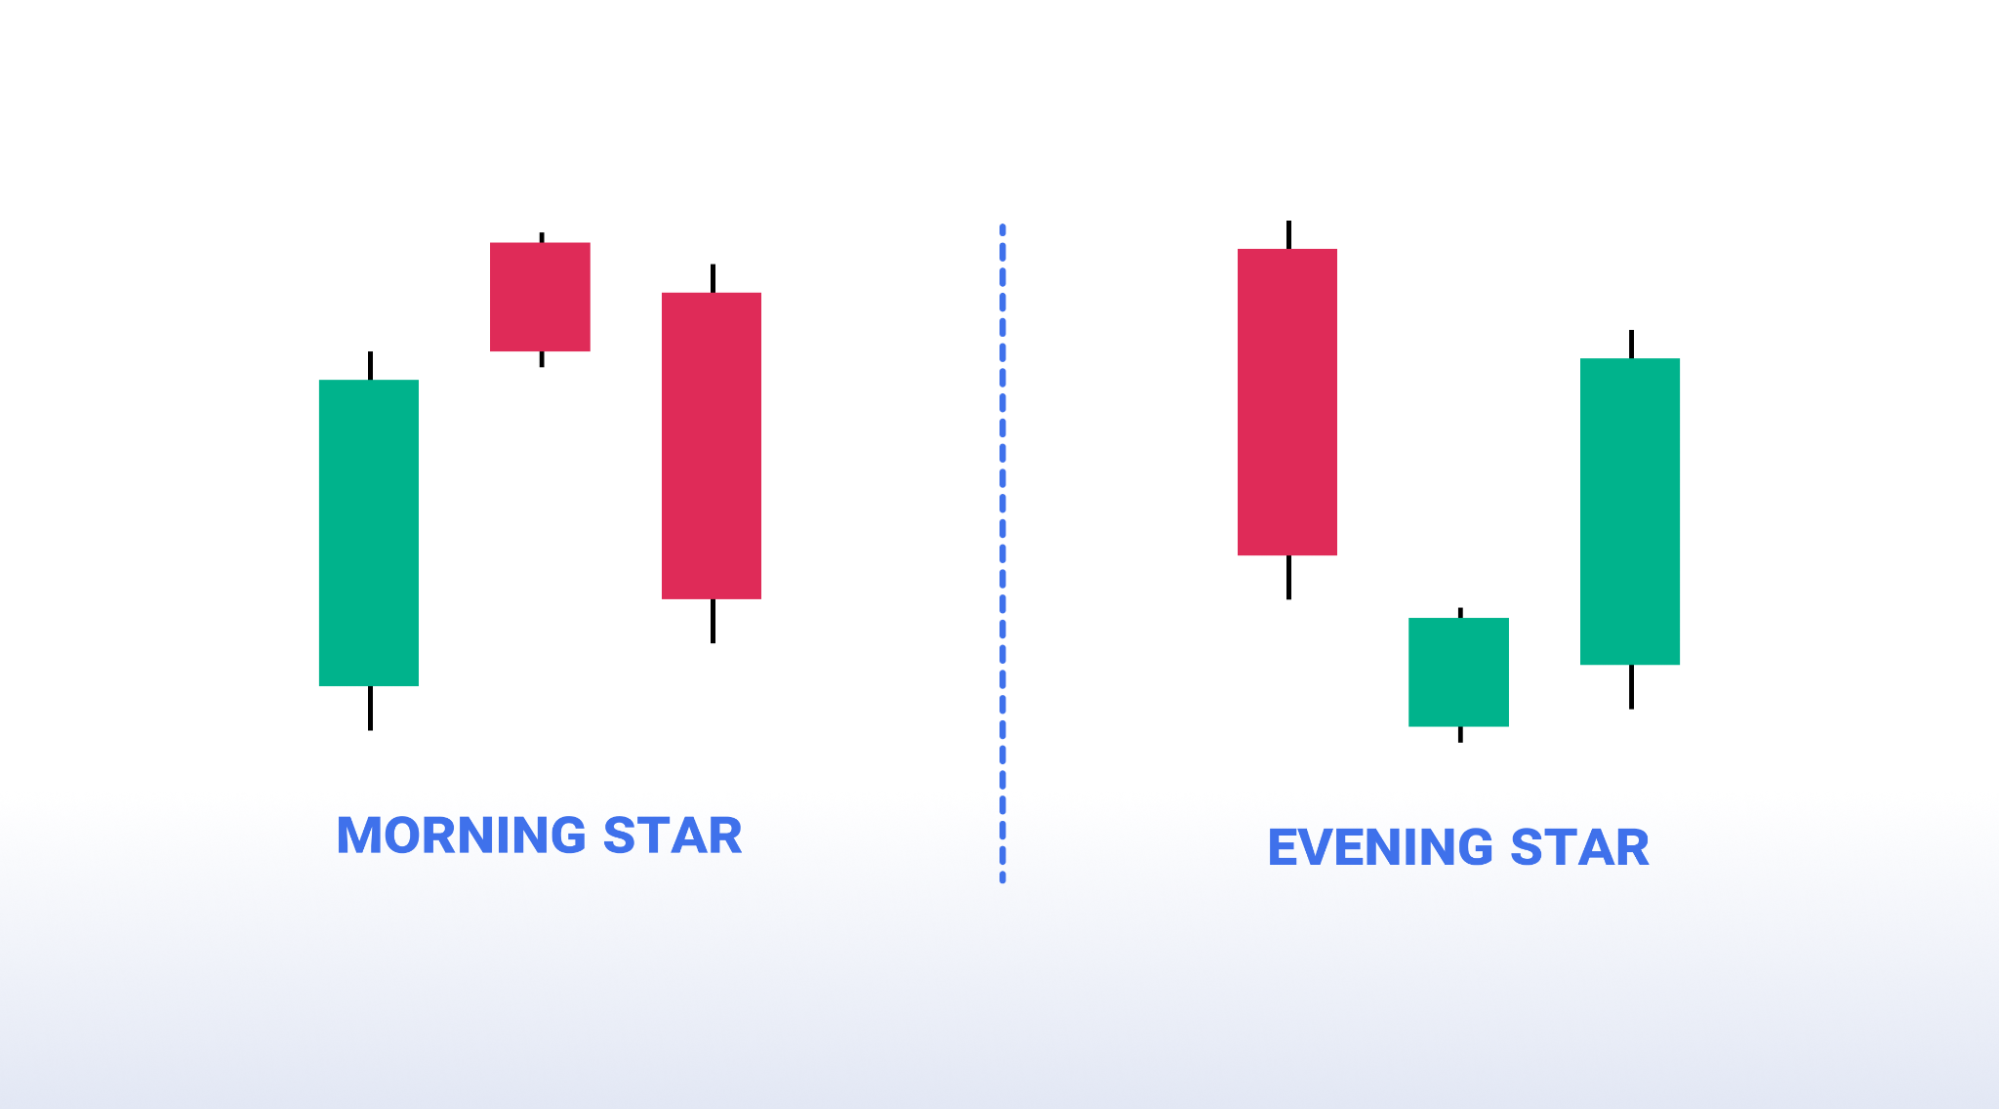
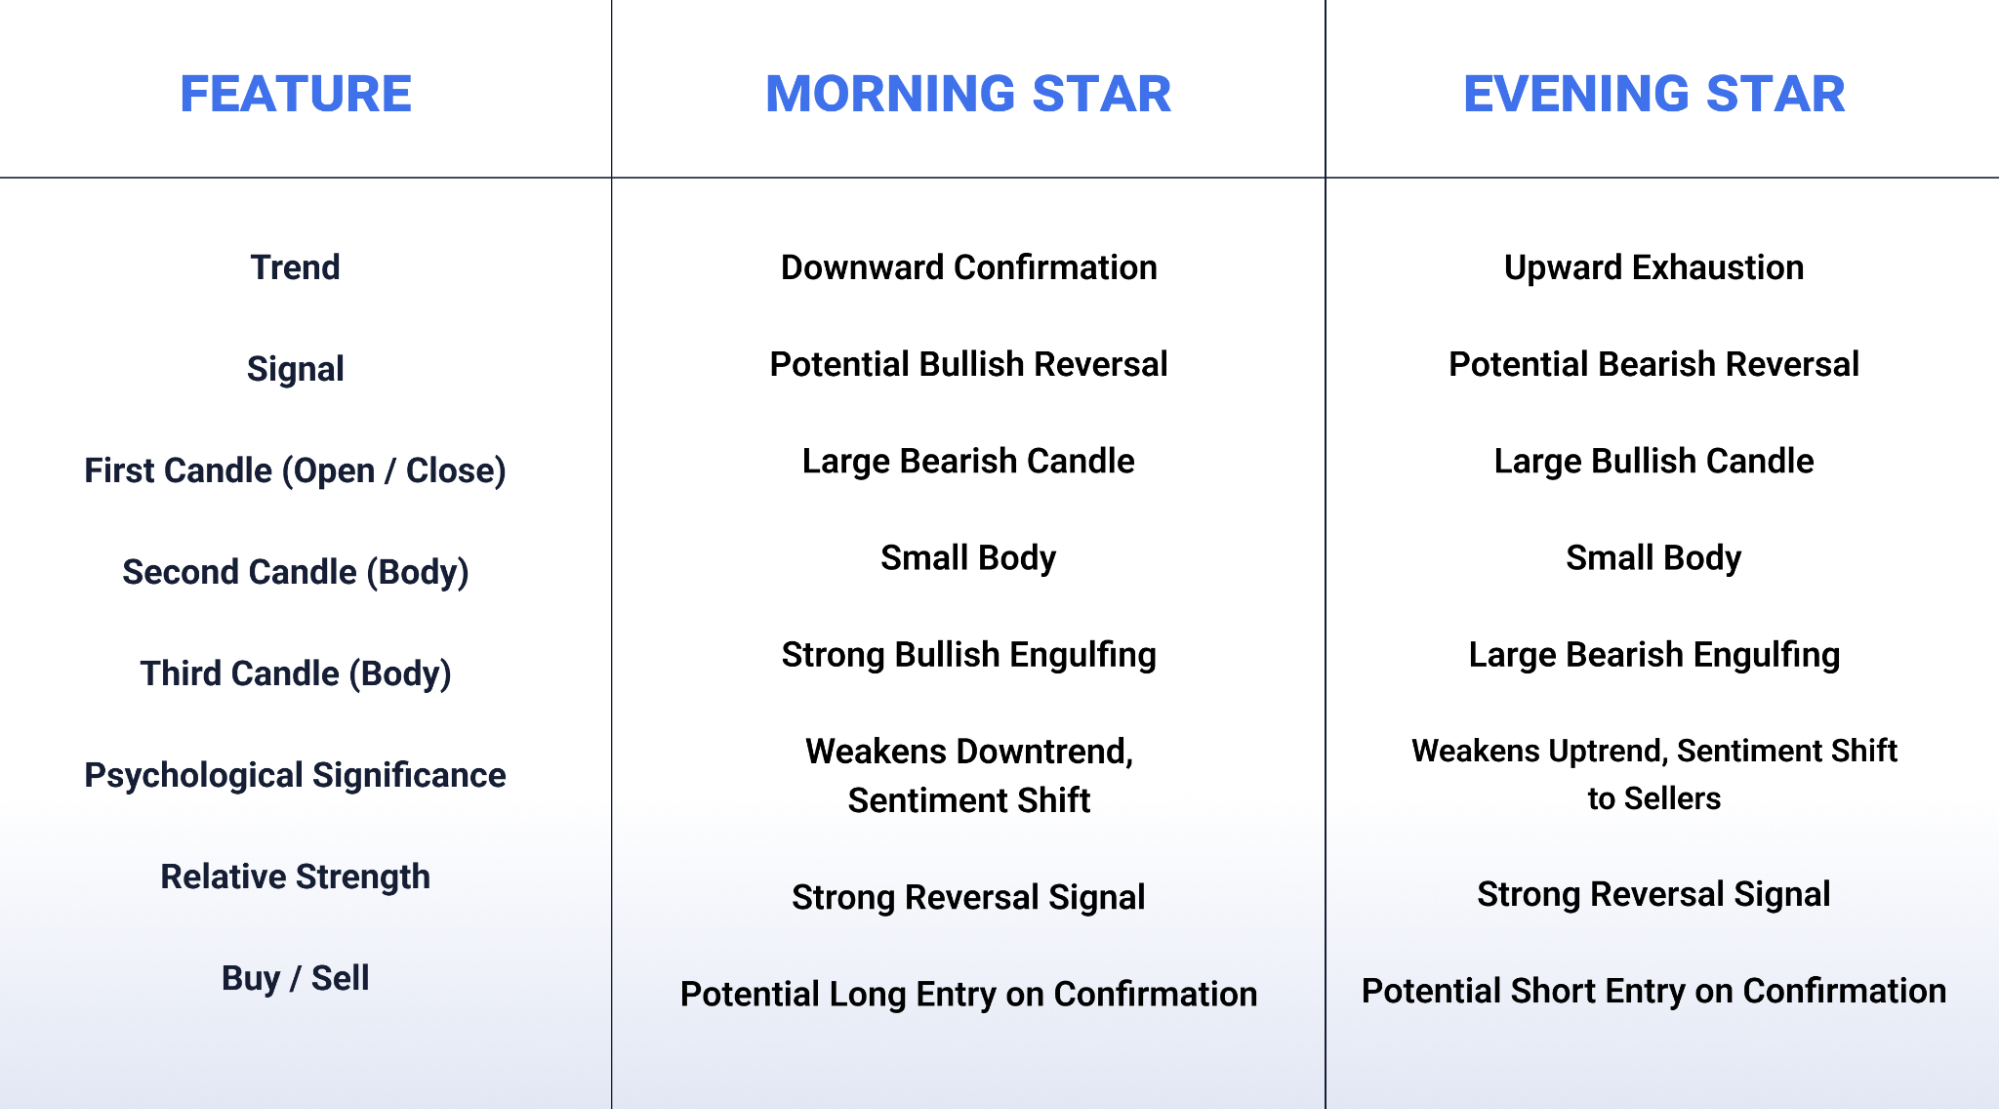
Morning Star v/s Evening Star
Here is how they differ in their particular features –
Tips to Trade a Morning Star Pattern
The morning star pattern offers a potential opportunity to enter long positions after a downtrend. Here are some tips to improve your trading strategy when encountering this pattern:
Identifying the Pattern
- Downtrend Confirmation: Look for a clear downtrend established by a series of lower lows and lower highs.
- First Candle (Bearish Engulfing): This is a large red (or black in some charting platforms) candle, confirming the downtrend.
- Second Candle (Doji or Star Doji): This is a smaller-bodied candle, ideally with long wicks extending above and below the opening/closing price. It signifies indecision in the market.
- Third Candle (Bullish Engulfing): This is a strong green (or white) candle with a substantial body and close significantly higher than the prior period’s close. This signifies a surge in buying pressure.
Trading Strategies
There are 2 main entry approaches –
- Conservative: Enter the trade after confirmation on Day 4 (P4) if the price remains above the close of Day 3 (P3). This reduces the risk of a false signal but offers a potentially less profitable entry point.
- Aggressive: Enter the trade on Day 3 (P3) after the bullish engulfing candle closes. This offers a potentially better entry point but carries a higher risk of a false signal.
Risk Management
- Stop-Loss: Always place a stop-loss order below the low of Day 2 (P2) to limit potential losses if the downtrend resumes.
- Take-Profit: There’s no one-size-fits-all approach. Consider your risk tolerance and profit target. Here are some options:
- Profit Target at Resistance: Set a take-profit order near a historical resistance level where you anticipate the price might face selling pressure.
- Trailing Stop-Loss: Gradually adjust your stop-loss upwards as the price moves in your favor to lock in profits.
Conclusion
The morning star pattern is a valuable tool for identifying potential trend reversals from downtrends to uptrends. After gaining a comprehensive understanding of its three-candle structure, the psychological shift it reflects, and its differentiation from similar patterns, this knowledge empowers you to effectively utilize the morning star pattern within your trading strategy, incorporating entry and risk management techniques. Remember, the pattern’s efficacy is enhanced by using it alongside other technical indicators like RSI and MACD, and a thorough analysis of the market context.
By actively seeking out morning star formations on charts and practicing with paper trading, you can solidify your understanding and transform this knowledge into actionable insights. This, in turn, will enable you to make more informed trading decisions and navigate potential trend reversals with increased confidence. So, embark on your technical analysis journey, identify those morning stars, and put your learnings to the test.
Looking to set foot in the trading world? You can open a FREE demat account with TradeSmart. Along with real-time support during market hours, we also offer a variety of educational resources to help you navigate the market.
FAQs
What is a morning star candlestick pattern?
The morning star is a three-candle bullish reversal pattern seen after a downtrend. It suggests a possible shift in momentum towards an uptrend.
How can you identify a morning star pattern?
Look for a large bearish candle followed by a small doji or spinning top candle, and then a strong bullish engulfing candle.
What does a morning star pattern tell you about the market?
The morning star suggests the bears are losing control and bulls are gaining strength, potentially signaling a trend reversal from downtrend to uptrend.
Is the morning star pattern a reliable indicator?
The morning star is a relatively reliable indicator, but not foolproof. Consider other technical indicators and market context for stronger signals.
Are there any false signals with the morning star pattern?
Yes, the morning star pattern isn’t guaranteed. Sometimes, even after the pattern appears, the market might continue downtrending. This is known as a “false breakout.”
How can you improve the reliability of a morning star signal?
There are ways to strengthen the morning star signal –
- Look for the pattern near support levels, areas where the price tends to bounce back up.
- Use the morning star alongside other technical indicators like RSI or MACD for confirmation of a potential reversal.
- Consider waiting for confirmation from the following day’s price action, ideally showing continued buying pressure.