A Guide to Sideways Market: Meaning, Strategies, Pros, and Cons


A sideways market, also known as a range-bound market, is a scenario in the stock market where there’s no clear upward or downward trend. In this type of market, prices of assets move up and down within a specific range without showing any consistent direction. This can make it tricky for traders since the market doesn’t provide strong clues on whether prices will rise or fall significantly. 

Sideways markets are marked by periods of volatility and uncertainty, making it challenging for traders to decide whether to buy or sell. During such times, traders often find it hard to make a profit due to the lack of sustained movements in asset prices. This might reduce their trading activities to avoid higher trading costs. 

The balance in buyer and seller activity can lead to a temporary pause in price trends until new information emerges to determine the market’s direction.

Characteristics of a Sideways Market

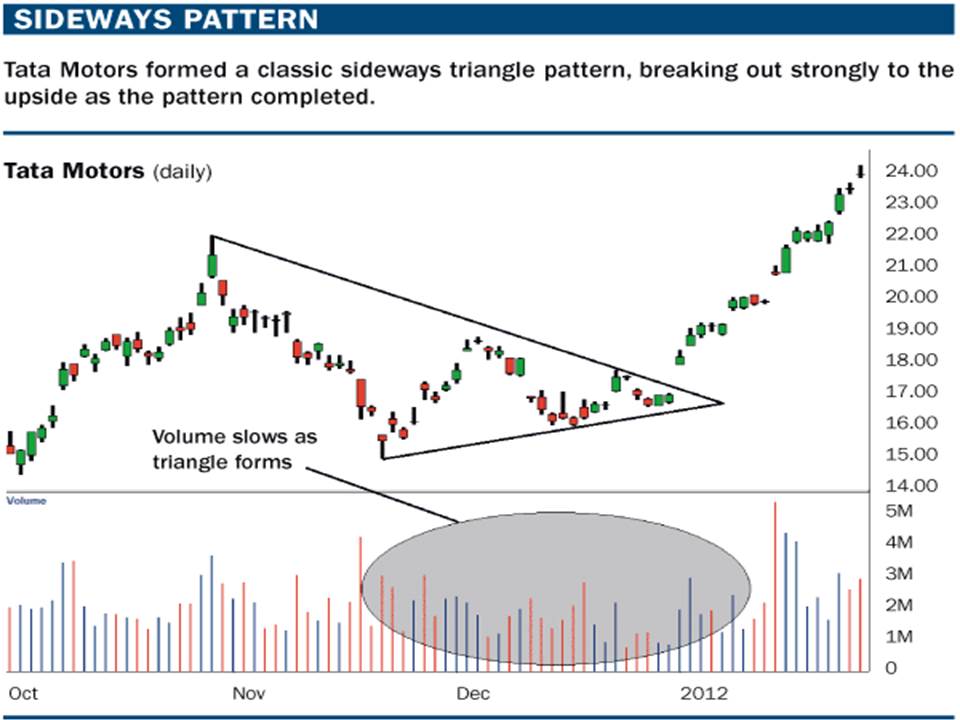
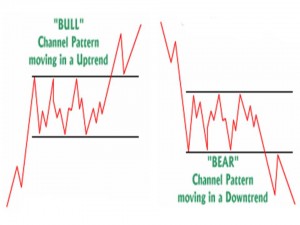
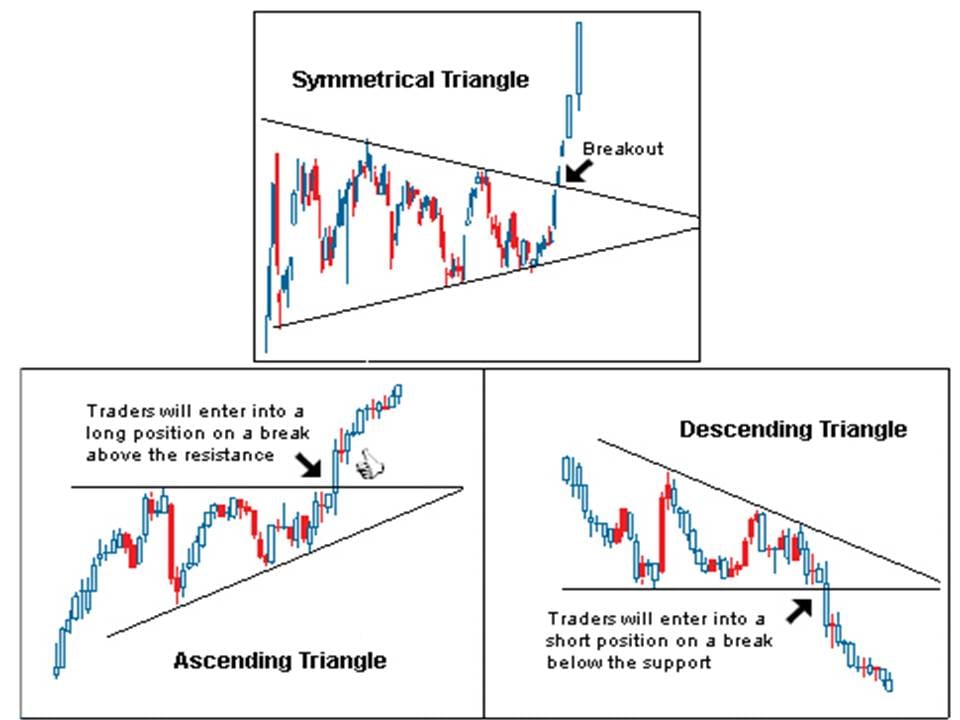
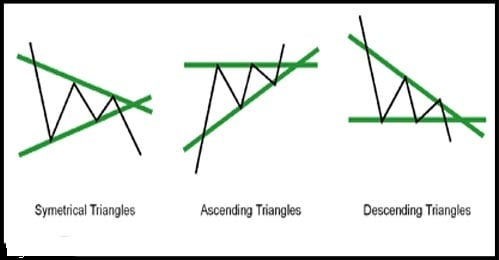
Support and Resistance Levels: In a sideways market, prices tend to fluctuate between well-established support and resistance levels. These levels indicate where buying or selling pressure is strong enough to prevent further price movement.

Consolidation Phase: This phase typically follows significant price movements and may indicate a potential trend reversal or continuation. It reflects a period of indecision among investors.

High Economic Growth and Valuation: Sideways markets often occur during periods of high economic growth and elevated stock valuations, despite the narrower profit margins.

Stable Trading Volume: The trading volume in a sideways market usually remains consistent, reflecting an even balance between buyers and sellers.

Potential Precursor to Bull Market: Sideways markets can precede bull markets, especially if initial valuations are high, which may prolong the sideways phase.

Short-Term Traders: These markets attract short-term traders like day traders and swing traders who look to capitalise on the range-bound price movements.

Emotional Balance: The lack of strong bullish or bearish trends helps maintain a relative calm among investors, contributing to price stability.

False Breakouts: Sideways markets are prone to false breakouts where prices temporarily breach support or resistance levels, misleading some traders about the start of a new trend.

How to Identify a Sideways Market?

Here are the essential signs and tools to help spot a sideways market:

Consistent Price Movement: Observe whether price movements are within a defined range over a period. This consistency is a primary indicator of a sideways market.

Lower Trading Volumes: A reduction in trading volumes compared to normal levels can suggest a sideways market, as fewer traders are taking positions due to the lack of clear price trends.

Flatter Moving Averages: Moving averages that show little to no slope indicate that prices are not trending up or down significantly, which is a characteristic of a sideways market.

RSI (Relative Strength Index): An RSI level around the neutral point of 50 often suggests a balance in market forces, with no strong momentum in either direction.

Indicators for Navigating a Sideways Market

Successfully trading in a sideways market involves utilising specific analytical indicators that signal its presence:

Relative Strength Index (RSI): An RSI that oscillates between 40 and 60 often indicates a sideways market, helping identify overbought and oversold conditions.

Stochastics Indicator: Similar to RSI, this indicator helps detect overbought and oversold levels. Stochastics remaining between 50 and 70 typically signal a sideways market.

Average Directional Indicator (ADX): This tool measures the strength of a trend without indicating its direction. A low ADX value suggests a weak or non-existent trend, common in sideways markets.

Bollinger Bands: When these bands move sideways with little fluctuation, it indicates low market volatility, a hallmark of a sideways market.

Strategies for Sideways Markets

Wait and Watch: In a market without clear directional trends, some traders adopt a cautious approach. By maintaining their current positions and observing market movements, they avoid unnecessary risks while waiting for more definitive trading signals.

Break-Even Focus: Day traders in a sideways market often aim primarily to avoid losses. They manage their trades actively to break even or minimise losses, sometimes at the expense of potential gains. This strategy helps protect capital.

Wider Stop-Losses: Recognising the limited profit opportunities in a sideways market, traders might use wider stop-loss orders. This allows them to stay in trades longer without getting stopped by minor price fluctuations. This reduces the potential for premature exits and small losses.

Adjusting Time Frames: Traders who typically engage in frequent transactions throughout the day might need to adjust their strategies by extending their time frames. For those extending their time frames, entering long positions might be considered more strategic.

These strategies represent only a few popular examples and do not guarantee success, as market conditions can vary widely.

Advantages of Trading in a Sideways Market

Precise Entry and Exit Points: With clear support and resistance levels, sideways markets reduce uncertainty around entry and exit points. Traders can buy when prices touch the support level and sell at the resistance, setting stop-loss orders just below support to minimise losses.

Risk Management and Control: The shorter durations of trades in a sideways market, often just days or weeks, limit exposure to broader market downturns or unexpected events. This allows traders to manage risks more effectively. This includes closing positions before major announcements like earnings reports and re-entering at optimal prices.

Predictable Price Ranges: Prices tend to move within a well-defined range, allowing traders to forecast price movements more accurately to set precise entry and exit points.

Lower Volatility: The reduced price fluctuation in a sideways market means lower risk. This stability helps traders manage their investments more comfortably and mitigates the potential for large, unexpected losses.

Asset Accumulation: Sideways markets provide opportunities to buy assets at the lower end of the price spectrum and sell at higher points within the same range. This strategy enables traders to accumulate assets at more favourable prices, optimising their investment value over time.

Disadvantages of Trading in a Sideways Market 

Increased Transaction Costs: Frequent trading within a range leads to higher transaction costs. Each trade incurs commission fees, which can add up and cut into overall profits, especially since the gains from each trade are typically modest.

Time-Intensive: Capitalising on the profit potential of a sideways market requires active management, including meticulous planning of entry and exit points and continuous monitoring of trades. 

Complex Automation: Many traders automate their strategies to reduce the time they need to spend monitoring the market. However, requires a good understanding of technical analysis and the specific market conditions. Complex automation strategies can be risky if not implemented and monitored carefully.

Conclusion

A sideways market presents unique challenges and opportunities, pushing traders to refine their strategies, adapt, and practice precision. Traders benefit from clearly defined entry and exit points, reduced long-term risk, and a variety of strategic options. For beginners, this environment serves as an excellent training ground to learn and implement tactics such as range trading and option selling, which are particularly effective in low-volatility conditions.

Ultimately, a sideways market is an integral part of the trading landscape, emphasising the need for adaptability and diverse strategies to achieve success in the financial markets.

Get a Suite of Stock Market Solutions in One Place

Open a free Demat account and get access to TradeSmart’s advanced stock trading technology for a powerful trading experience. Get personalised insights from our team of experts that has more than 2 decades of experience in the stock markets of NSE and BSE.

Disclaimer: This article is for information purposes only and should not be considered as stock recommendation or advice to buy or sell shares of any company. Investing in the stock market can be risky. It is therefore advisable to research well or consult an investment advisor before investing in shares, derivatives or any other such financial instruments traded on the exchanges.

FAQs

What is a sideways market?

A sideways market occurs when stock prices oscillate within a certain range without establishing a clear upward or downward trend, typically due to balanced buying and selling pressures.

How can you recognise a sideways market?

Recognising a sideways market involves looking for consistent price movements within a specific range, noting reduced trading volumes, and employing technical indicators like flat moving averages and an RSI close to 50.

What distinguishes a sideways market from a trending market?

Unlike a trending market, which shows a clear directional movement either upward or downward, a sideways market lacks such a distinct trend and shows prices moving within a confined range.

What is the typical duration of a sideways market?

The duration of a sideways market varies, influenced by market sentiment and relevant news events, but it generally lasts a few weeks.

Is trading profitable in a sideways market?

Trading in a sideways market can be profitable, particularly with strategies designed for range-bound conditions, although it may not be suitable for everyone. There are inherent risks associated with these approaches.

Are sideways markets characterised by high volatility?

Sideways markets are usually less volatile compared to trending markets, as price movements are confined within a specific range without strong directional trends.


Related

Open Demat Account With TradeSmart

Lowest Brokerage Ever Trade @15 Per Order
Download TradeSmart App Now

Scan below QR Code
to download App