Among the different types of trading forms, Intraday trading stands out for being the type of trading that makes use of lots of technical analyses. Since the buying and selling are executed on the same day, there is no room for holding positions in intraday trading. Therefore, the fundamental analysis only helps intraday traders a little. The main goal of an intraday trader is to catch the momentum and place bets for a short duration.
Intraday traders can trade within the stock market exchange durations, i.e., from 9:15 AM to 3:30 PM. During this session, only specific time frames are most suitable for intraday trading. As an intraday trader, you’d need a proper framework to work within such a short duration. And that’s where technical analysis plays a significant role.
Technical analysis involves studying charts that graphically portray the price movements. As the fluctuations in the prices of the stocks take place, certain patterns are formed on these charts. These patterns, which are called chart patterns, are used by traders to place intraday bets.
Let’s have an in-depth look at what Intraday Chart patterns are, their importance, and how to use them for trading. We’ll also learn about some of the most frequently formed chart patterns that can help build an effective trading setup.
What are Charts?
Charts in the stock markets are a representation of how the price has moved in the past and how it is moving in the present. It basically shows the fluctuations in stock prices, according to which traders try to predict how the price will move in the future.
There are various types of charts like Candlestick, Renko, Line, Bar, Heikin Ashi, etc. Different traders use different types of charts for trading, but the most commonly used chart is the candlestick chart.
On candlestick charts, many patterns are formed based on how the price has moved in the recent past. These patterns represent the price behaviour that tells you a story. We will see what each type of pattern portrays.
Why are Intraday Chart patterns important?
It is always easier to see an illustration to understand a topic rather than reading lots of textual information about it. In the same way, it is easier for most traders to understand price fluctuations illustrated in the form of chart patterns instead of having to look at loads of data.
Chart patterns have been in use since the 17th century and have undergone a lot of advancement, all thanks to technology and innovations. Since Intraday trading occurs in a very short span of time, opting for the traditional method of analyzing data would give prolonged results.
Intraday Chart patterns offer traders a tool to understand price fluctuation psychology, analyze market movements, and make intelligent decisions. They also provide traders insights into the trends and reversals in the stock market.
How to use Chart Patterns for Intraday trading?
If you’re someone who is new to the concept of chart patterns, you might wonder how traders trade using them. So, before having a look at the different types of chart patterns, let’s have a look at how you can use them for trading.
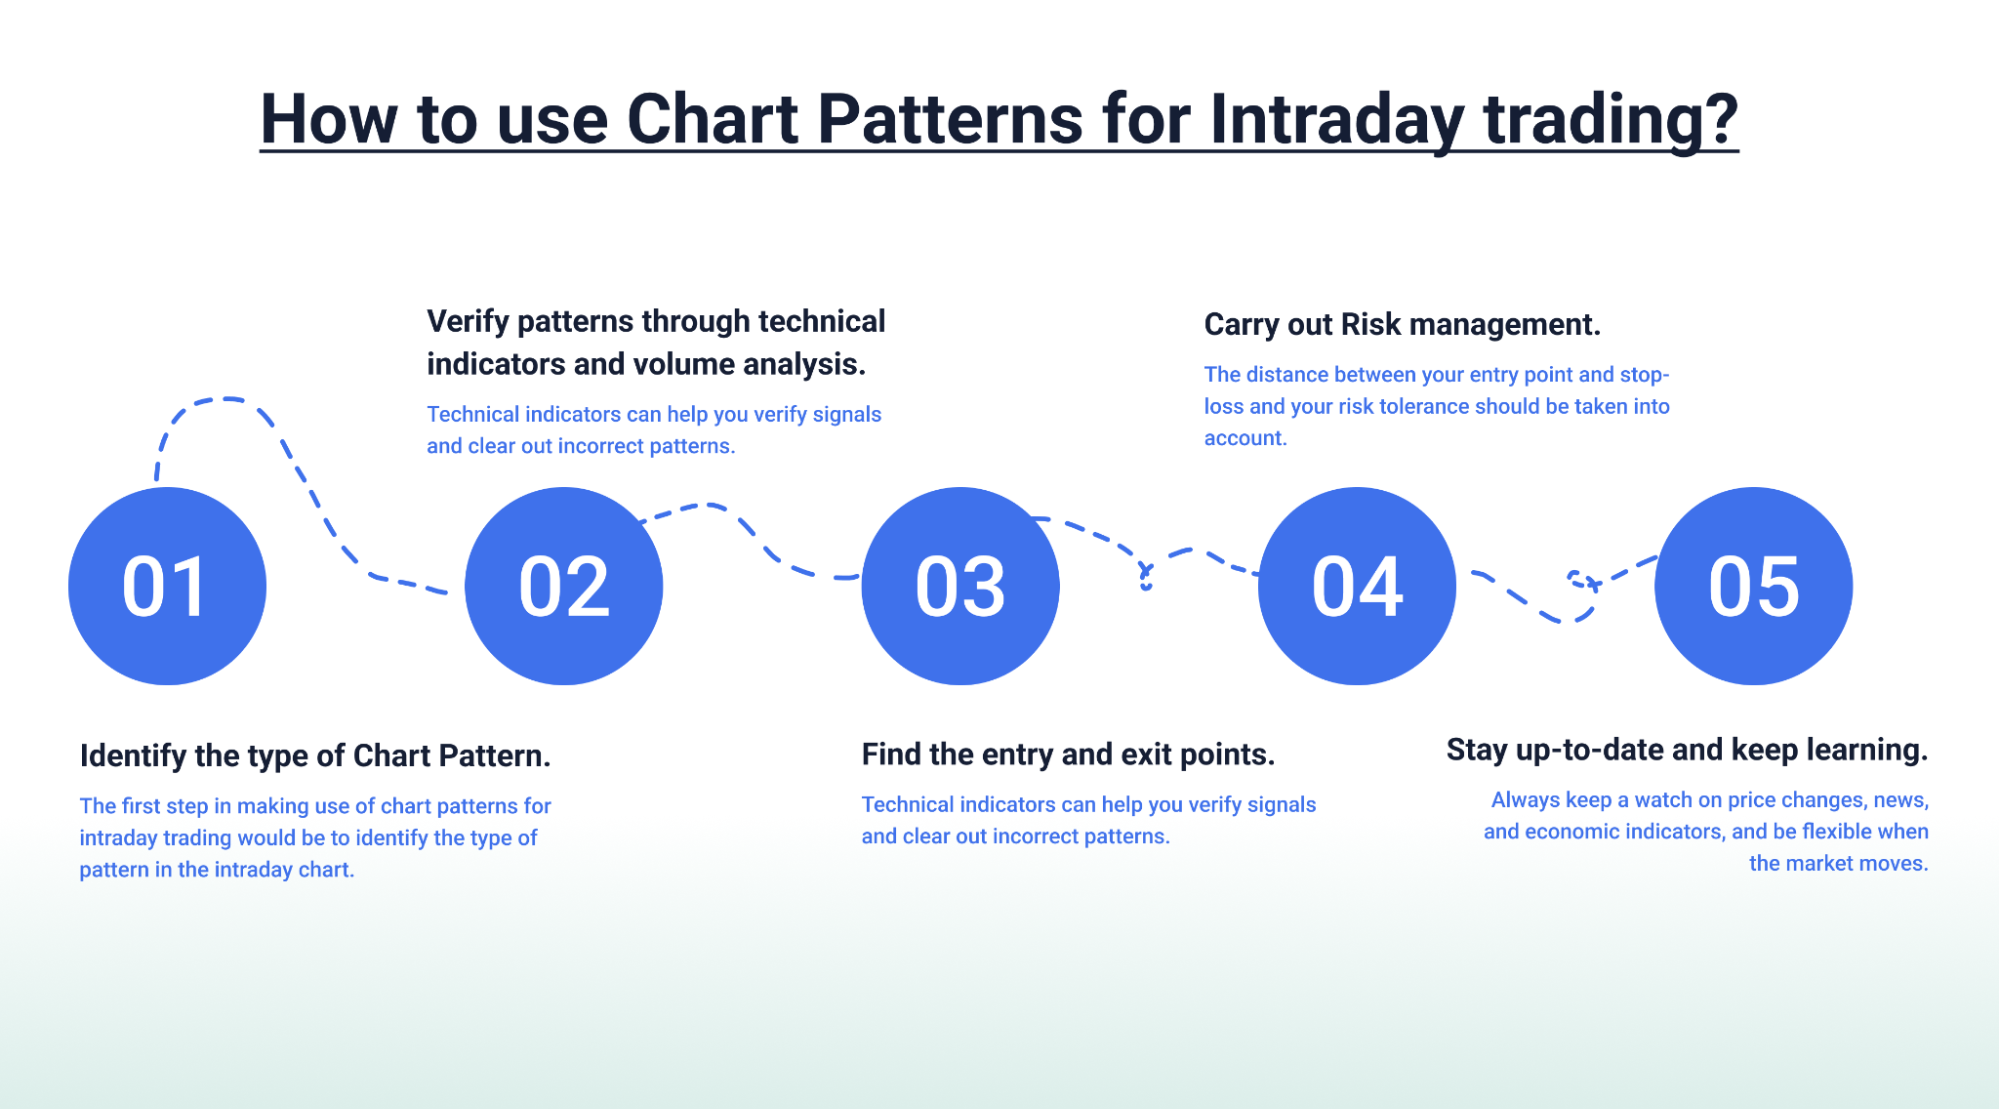
Step 1: Identify the type of chart pattern.
The first step in making use of chart patterns for intraday trading would be to identify the type of pattern in the intraday chart. You’ll be able to identify recognizable chart patterns like triangles, wedges, flags, etc. Once you have determined the pattern, check the prevailing trends to see if it would result in successful trades.
Step 2: Verify patterns through technical indicators and volume analysis.
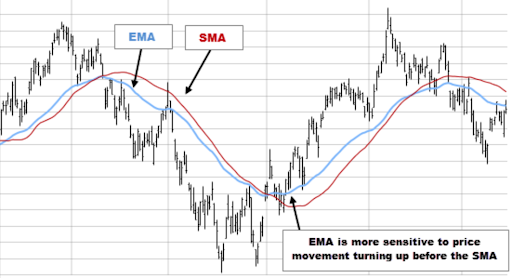
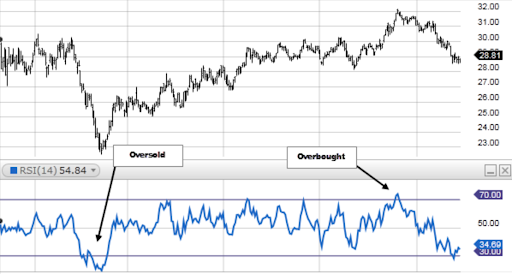
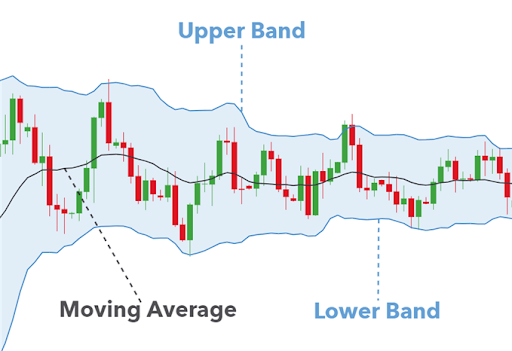
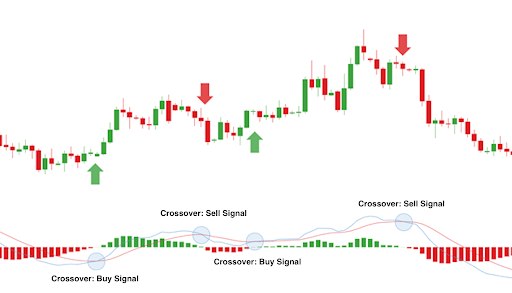
Technical indicators can help you verify signals and clear out incorrect patterns. Examples of these indicators are stochastic oscillators, moving averages, RSI, and MACD. The authenticity of chart patterns can also be verified by examining the volume levels that correspond with price changes. A breakout or breakdown having a high volume provides credibility to the pattern.
Step 3: Find the entry and exit points.
You can identify entry points based on the pattern’s essential levels, such as trendlines, support, or resistance levels, once you have seen a breakout or breakdown of those levels. One way to control risk and guard against unfavourable price fluctuations is to use stop-loss orders. It’s also a good idea to use dynamic indicators like Fibonacci retracements or extensions when setting objectives for profits depending on pattern size.
Step 4: Carry out risk management.
The distance between your entry point and stop-loss and your risk tolerance should be taken into account when determining how much to spend in a trade. It’s essential to avoid overinvesting; therefore, set a limit on the portion of your total funds that you devote to each deal. To keep your money safe, always adhere to your risk management guidelines.
Step 5: Stay up-to-date and keep learning.
Always keep a watch on price changes, news, and economic indicators, and be flexible when the market moves. If a circumstance arises, be prepared to adjust your plan or close off deals early. Moreover, you must remember to take lessons from every deal and journal your entry and departure points, along with your reasoning for each. This will help you know which strategies to follow and which ones went wrong.
Types of Chart Patterns
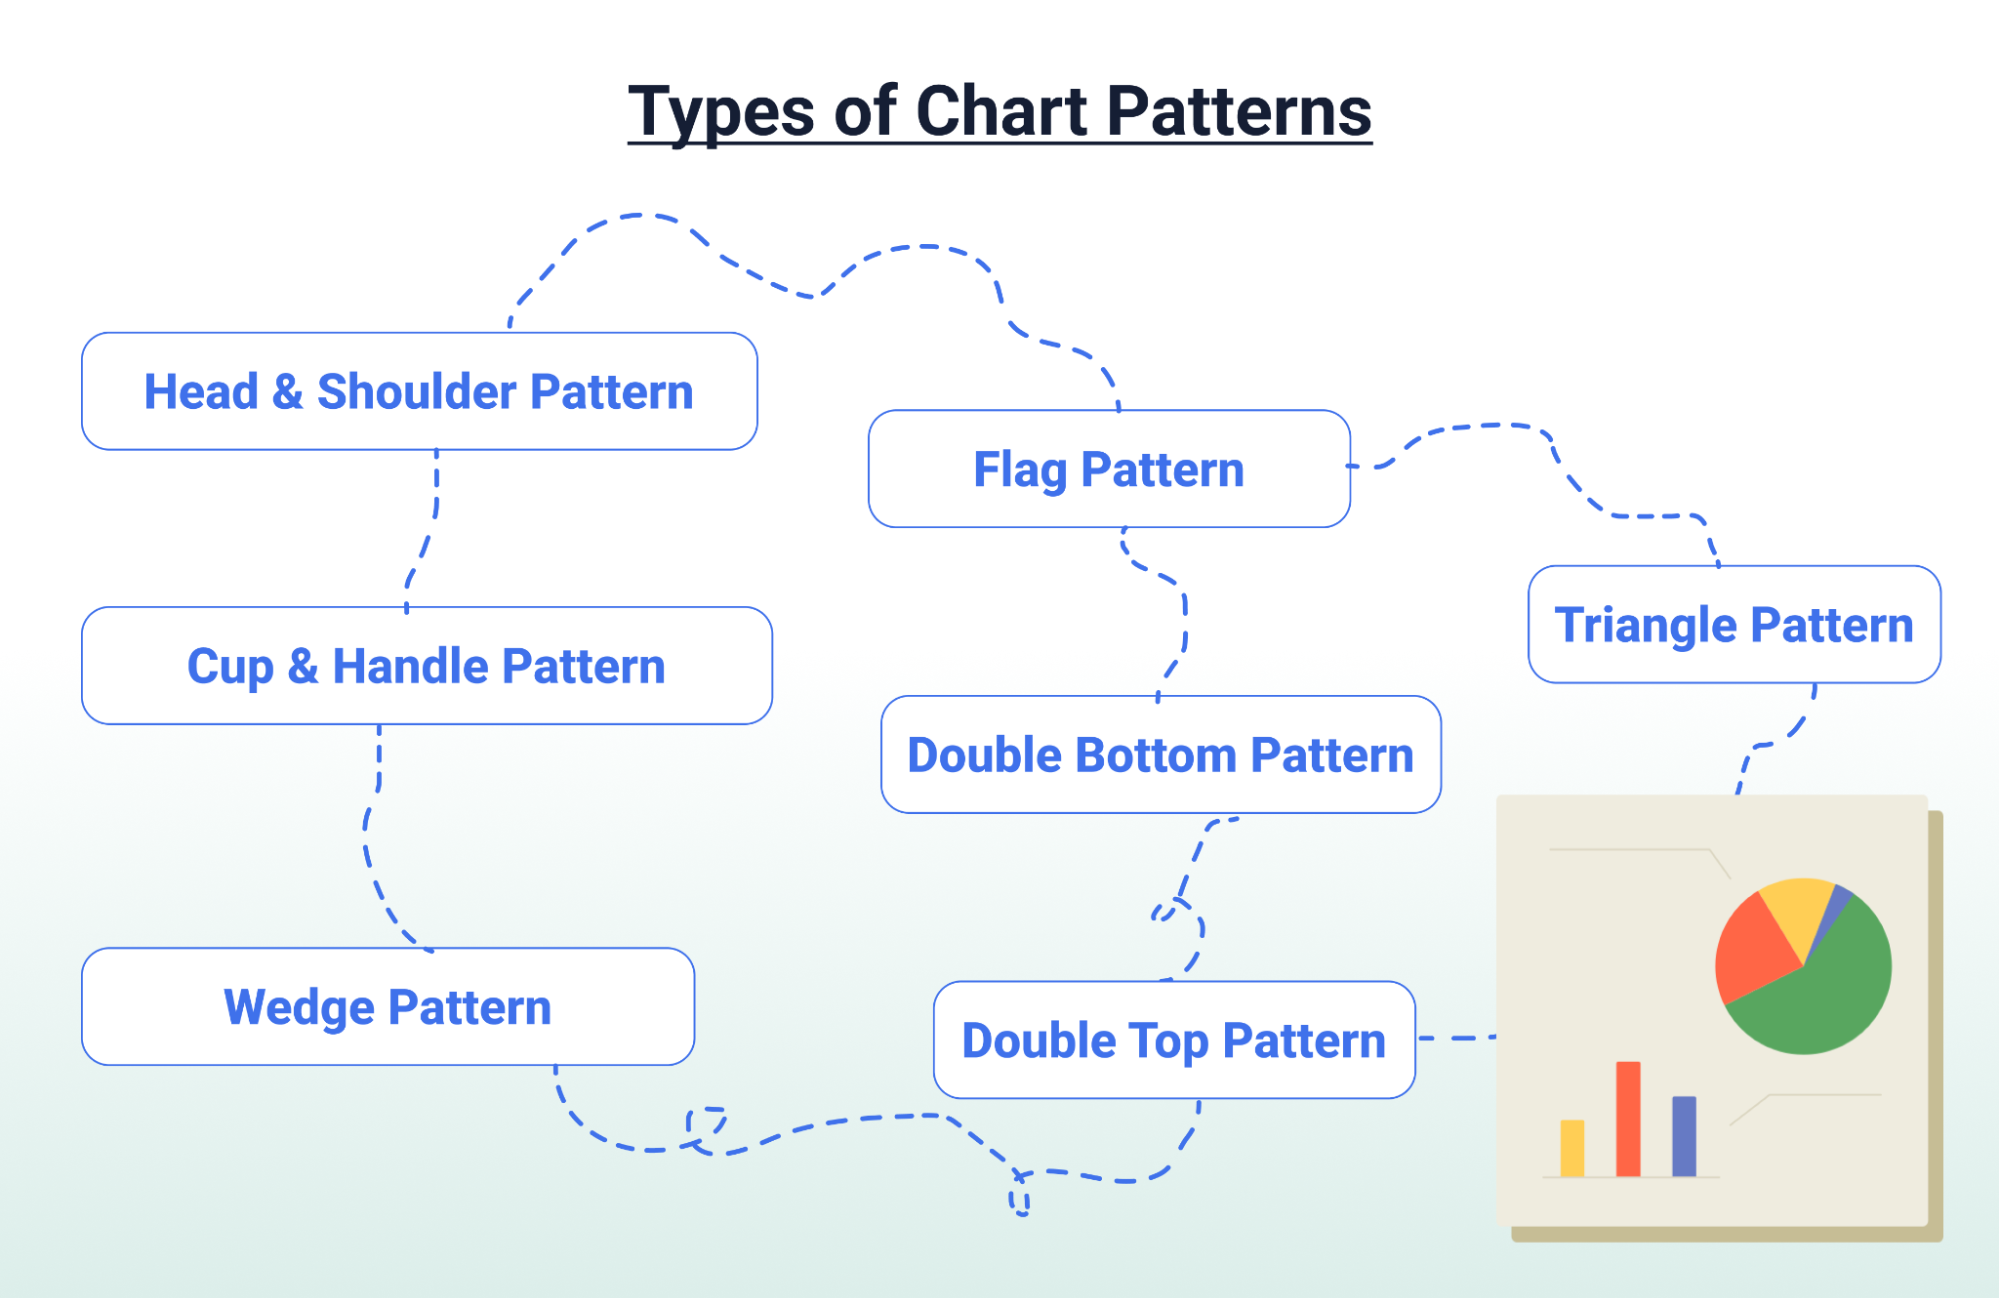
There are various types of chart patterns when it comes to trading assets; different assets can have different types of fluctuations, which ultimately lead to various patterns. Following are a few types of chart patterns that traders effectively use as a part of their trading setup.
- Head & Shoulder Pattern
- Cup & Handle Pattern
- Wedge Pattern
- Flag Pattern
- Double Bottom Pattern
- Double Top Pattern
- Triangle Pattern
Let us look at each of the patterns individually and learn how you can use them to boost your trading game.
1. Head & Shoulder Pattern
A typical head and shoulder pattern consists of a small left shoulder, a head-like structure in the center, and a right shoulder similar to the left shoulder. The baseline of the head and shoulder pattern is often called the neckline.
This is a bearish pattern, which implies that the sellers are actively trying to sell, whereas buyers’ attempts to take the price higher are failing. Once the neckline breaks down, the price can fall significantly lower.
A head and shoulder pattern is illustrated in the picture presented below.
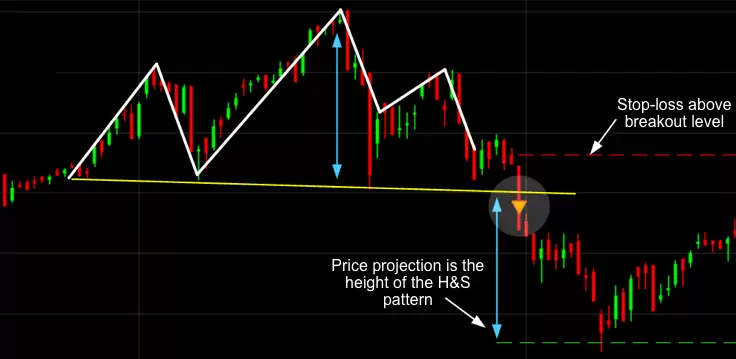
(Source: CMC Markets)
Intraday traders make the most out of such momentum. The opposite of the head and shoulder pattern is the inverse head and shoulder pattern. It is the exact opposite of the head and shoulder pattern (illustrated above). The inverse head and shoulder pattern implies that the share price is ready to break out and move higher once the neckline is taken out.
2. Cup and Handle Pattern
This is a bullish pattern and implies that the sellers have taken the price lower, but buyers absorbed all the selling and took the price back to the level from where it had started falling.
Another way of looking at this is that the sellers’ efforts to lower the price failed as buyers entered at the lower level. This reversal of price back to the upper level after taking a U-turn looks like a cup.
After reaching the same level again, the price halts for a while and forms a pattern that looks like the handle of the cup. Once the price goes higher from this level, a significant upward movement can be seen, which can be traded intraday. The image below illustrates the cup and handle pattern.
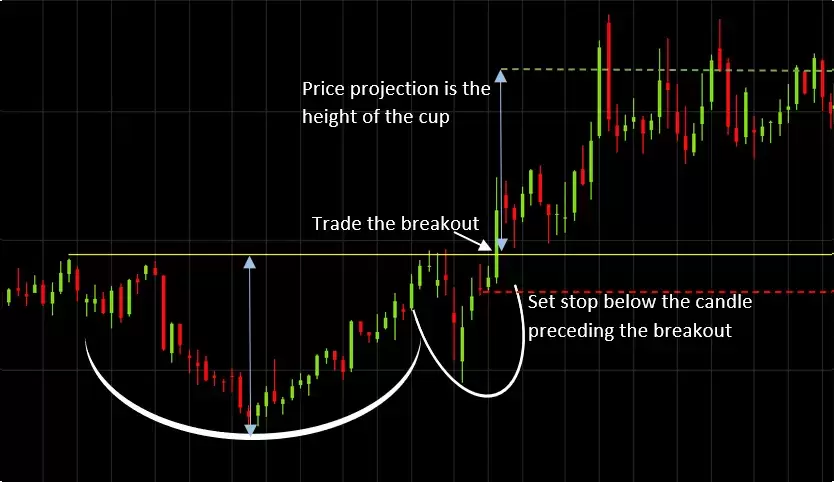
(Source: CMC Markets)
The opposite version of this pattern is the inverse cup and handle pattern, which gives a bearish signal when the price breaks down from the narrow range.
3. Wedge Pattern
The wedge pattern is often referred to as a micro trend. There are two types of wedges: rising wedges and falling wedge patterns. A rising wedge pattern is a micro uptrend that occurs in a major downtrend. When the trendline of this wedge breaks, the price can again join the major downtrend. This can allow intraday traders to ride the major trend.
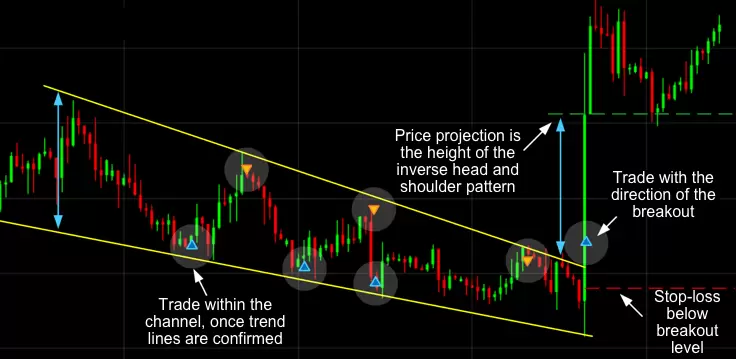
(Source: CMC Markets)
On the other hand, a falling wedge is a micro downtrend that forms when the major trend is bullish. This acts like a consolidation phase. When the price breaks out from the trendline of this wedge, it again joins the major uptrend, and traders can ride the major trend. Both these patterns are illustrated in the image above.
4. Flag Pattern
The flag pattern comprises a pole-like structure of candles and a small consolidation of the price, which appears like a flag on top of the pole. This pattern again represents a consolidation phase after a one-sided sharp momentum. However, this consolidation is a very small phase. Once the price breaks the upside of the flag, it can form another flag.
The image displayed below illustrates how the flag patterns form and how you can set the target based on the size of the flagpole.
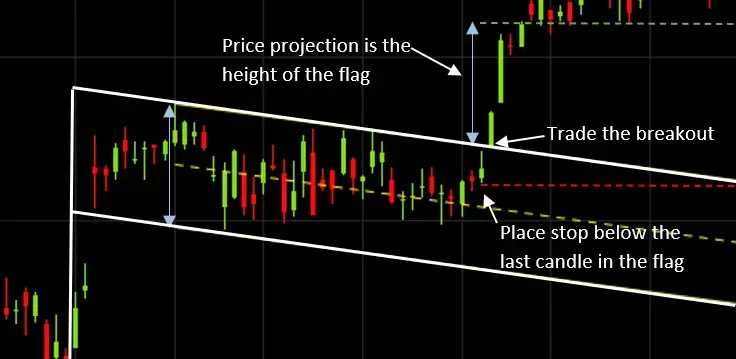
(Source: CMC Markets)
Usually, when the price is going up, it will make a few bullish flag patterns, and when the price is falling, a few bearish flag patterns are formed on the charts. As an intraday trader, you can make the most of these movements if you know about the patterns.
5. Double Bottom Pattern
The double bottom pattern is a bullish chart pattern. In this pattern, the price makes two lows at or about the same level before it starts a bullish uptrend. The level from where the price starts to rise again becomes a support or demand zone. This is because the price has taken support at that level despite the sellers trying to take the price lower twice. As an intraday trader, you can look for buying opportunities in such a demand zone.
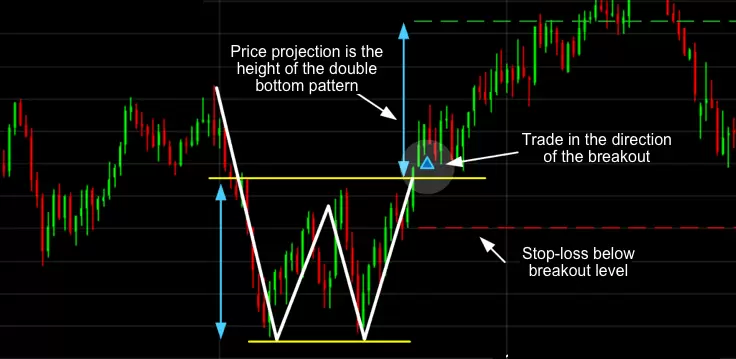
(Source: CMC Markets)
The above image illustrates an example of a double bottom bullish pattern on the actual stock chart.
6. Double Top Pattern
This is the opposite of the double bottom pattern. The double top pattern is bearish, which implies that the buyers tried taking the price higher twice, but sellers were actively selling at that level. Such a level can be called a resistance or supply zone, as the price resists going above that level, and sellers start supplying stock when the price reaches that zone. As a trader, you can use these levels to sell the stock as the price could fall further.
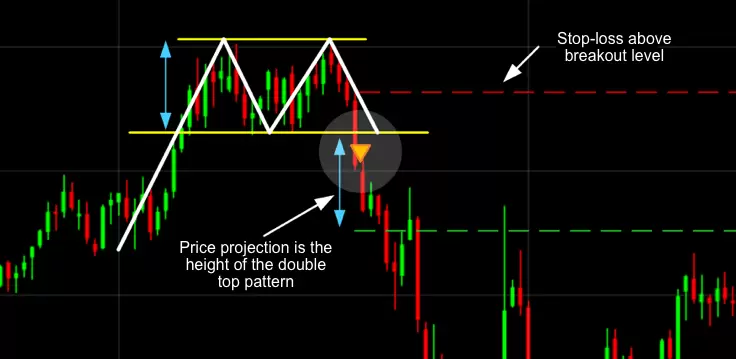
(Source: CMC Markets)
The above image illustrates how the double top pattern forms and the price moves on the downside after being rejected from the resistance zone.
7. Triangle Pattern
Three types of triangle patterns form on charts. They are:
- Symmetrical Triangle,
- Ascending Triangle, and
- Descending Triangle.
Let us look at them one by one.
i. Symmetrical Triangle Pattern
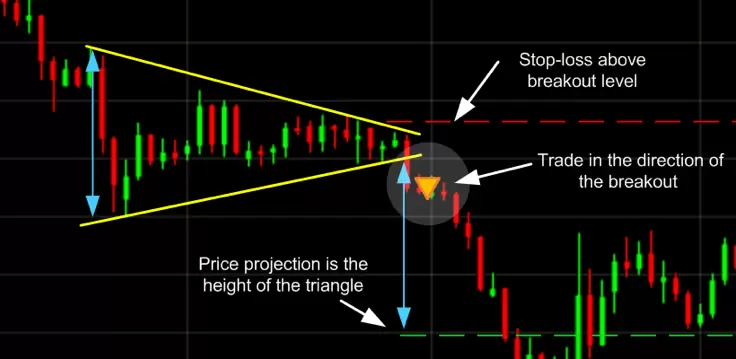
(Source: CMC Markets)
In this pattern, there are lower highs and higher lows. This means that as each candle forms, the price gets squeezed into a smaller range, as illustrated in the above image. In such cases, the price could move in any direction.
Often, when there is a tough fight between buyers and sellers, this type of pattern forms. You must wait for the breakout on either side before taking the trade when such a pattern forms.
ii. Ascending Triangle Pattern
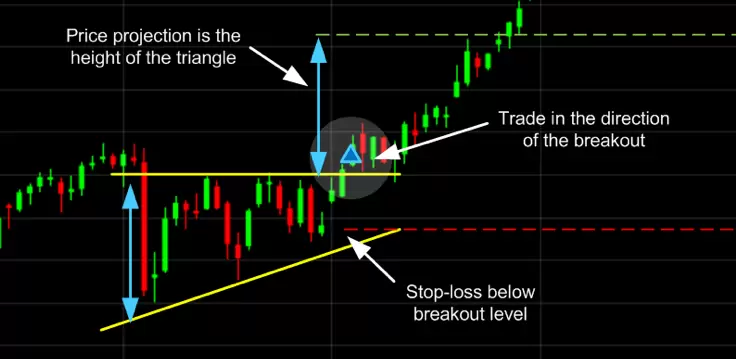
(Source: CMC Markets)
The ascending triangle pattern is a type of bullish pattern where all the swing highs are at the same level, and each low is higher than the previous low. With each candle, the price keeps shifting higher but stays under the resistance zone.
This implies that the buyers are slowly inching higher, and the impact of sellers is diminishing. Once the swing high is taken out, the price could move significantly higher. You can refer to the image provided above to understand better.
iii. Descending Triangle Pattern
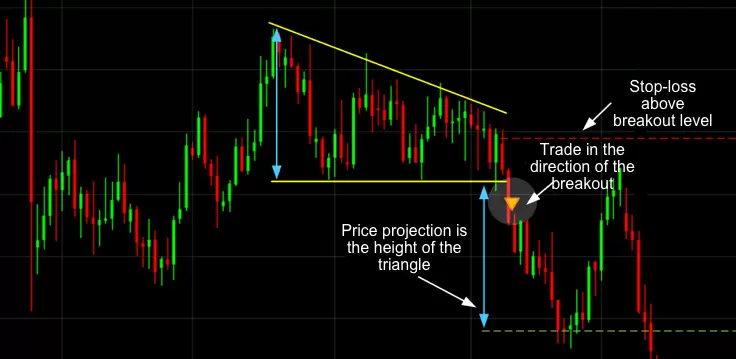
(Source: CMC Markets)
This type of chart pattern is a bearish pattern and is the opposite of the ascending triangle pattern. In this, the swing lows are at or about the same level, whereas there are consistently lower highs. It forms when sellers are getting more robust and buyers are losing strength.
You can take advantage of price fall when the swing lows are broken. Please refer to the illustrative image provided above for a better understanding of the descending triangle pattern.
The Bottom Line
Trading is an incessant process where a trader never stops learning. Studying the prices of different assets has always been a nerve-wracking task for traders. Chart patterns provide traders with an easy and accessible way to learn more about the fluctuations in assets’ prices.
Though most of these patterns are commonly formed in intraday trading sessions and can be used effectively to trade the stocks or index, you must also take multiple confirmations with the help of some technical indicators and volume analysis.
TradeSmart provides you with a robust trading platform with advanced charting options that are loaded with 80+ technical indicators to choose from. You can check out TradeSmart’s website and explore the plans that offer the lowest brokerage in India.