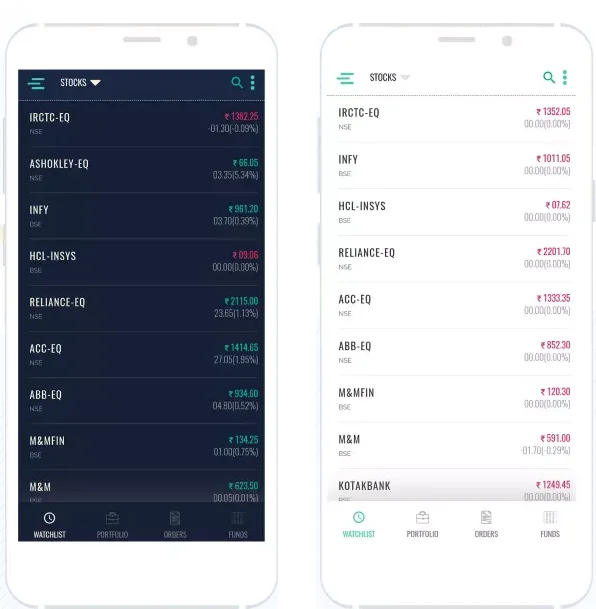
How to Open a Demat Account?

The sooner you start investing, the more benefit of compounding you enjoy! As more and more people are learning about the power of compounding and investing, the number of DEMAT accounts is on the rise. Young India is moving from conventional savings assets like Fixed Deposits to investing in growth assets like Mutual Funds, ETFs, SIPs, etc. If you are on the lookout for starting your investing journey as well, you need to first get a DEMAT account. The shares that you purchase needs a safe house to stay and DEMAT accounts provide that shelter to your investments.

So in this blog, we will first get into knowing the DEMAT accounts and then learn the simple procedure you need to follow to open your DEMAT account. So let’s get started!

What is a Demat Account?

  • A Demat Account is a facility used for storing and trading securities. It facilitates easy and quick trade by allowing users to buy and sell shares.
  • It is a place where an individual can store and manage their various investments.

Was that confusing? Let us make it very simple. You can compare a Demat account with a locker in your house where you safely store all your valuables. Except, in the case of the Demat account, the valuables are investments assets like shares in electronic form.

Note: It is important to note that a Demat account is different from a trading account. A trading account only facilitates buying and selling of shares whereas Demat account stores those shares. Typically, the Demat account and trading account are offered as a two-in-one product by the brokerage firms in India.

Procedure to Open a Demat Account

Did you know that since 1996, daily 4340 Demat accounts have been opened with NSDL alone? This has demanded the account opening process become very simple and hassle-free. Here’s a step-by-step guide that will help you get started with opening a Demat account.

  • Step 1: Online Application

    You can log on to the website of TradeSmart or download the app and make an online application for opening a Demat account. All the brokers provide online account opening facilities. For the offline process, you can visit their registered office and begin the process by filling out a physical application form. You can also opt for E-KYC in which along with the Aadhar Number, you only need to provide supporting documents for address and identity proof, PAN Card, cancelled cheque and 6-months bank statement. For EKYC, it’s very important that your email id and the mobile number are linked with Aadhar.

    For offline processes to open a demat account, you can either download the account opening form from the TradeSmart website or if that doesn’t happen then you can request the company to courier the documents to your address with some nominal charge.

  • Step 2: Upload the Documents

    All the necessary documents are mandatorily required to be submitted to initiate the process of opening a Demat account. With this, the Know-Your-Customer (KYC) norms are fulfilled. This process can be done by uploading an e-copy of documents on the TradeSmart website or mobile app. The list of documents required are:

    • Self attested copy of your pan card
    • Self attested copy of address proof – driving license, ration card, aadhar card, electricity bill are some of the documents
    • One passport size photograph
    • One cancelled cheque
    • In-person verification – it requires a live photo of you so stock broking companies take a pic using laptop webcam or mobile phone front camera feature.
  • Step 3: Verification

    After the successful submission of documents, the verification process begins. The authenticity of all the documents is ensured before giving a go-ahead with the Demat account finalization.

  • Step 4: Confirmation of DEMAT Account

    Once the verification of documents is finished, you will receive a 16-digit unique identification code of your Demat account. With this, the process of opening a Demat account successfully ends.


List of Necessary Documents

The following is the list of documents required to open a Demat account.

  • Proof of Your Identity

    Any document that possesses your name and photograph suffices as identity proof. You can submit a document such as a PAN card, aadhaar card, election card, driving license, or any government-provided ID card.
  • Proof of Residential Address

    As proof of the address, you can submit any document that possesses the detailed postal address of your residence along with the city code. You can submit a copy of either aadhaar card, election card, passport, ration card, telephone or electricity bill held in your name, etc.
  • Bank Details

    To complete the process of opening a Demat account, you need to link your bank account with it. For this, you have to submit bank account details such as account number, passbook, or the recent statement of your bank account.
  • Proof of your Income

    To provide proof of your income, you can submit the salary slips received from your employer or the acknowledgment of IT return of the most recent assessment year submitted with the Income Tax Department.

What are the Charges to Open a DEMAT Account?

Every depository participant can have a different set of charges for opening a Demat account. But a general trend noticed in India is that most of the brokers offer a free Demat account opening facility whereas some charge a minor fee. Apart from that, the first-year annual maintenance charges are mostly waived off by the brokers. Technically, an investor has to pay AMC only from the second year onwards.

The following are general charges involved in opening a Demat account in India.

  • Account Opening Charges

    As per the recent trend, account opening charges are either nil or a very nominal amount is charged for the same. Most of the brokerage firms provide Demat, as well as trading accounts, and charges for such inclusive accounts might vary.
  • Custodian Fees

    Custodian fees is a fee paid by brokers to the depositories. This is either paid as a one-time charge or every month. The brokers that pay custodian fees to depositories every month pass on this charge to investors. It might range between 50 paise to Re. 1 per security.
  • Annual Maintenance Charges (AMC)

    As we discussed, most brokerage firms waive off the first-year annual maintenance charges. From the second year onwards, an AMC is levied for maintaining your Demat account. This fee varies from broker to broker but typically it ranges between Rs. 300 to Rs. 1000. It is divided into four equal installments and is charged every quarter.

    The charges TradeSmart offers are very competitive so that anyone can open a demat account and begin trading. The details of the charges are given below.The charges TradeSmart offers are very competitive so that anyone can open a demat account and begin trading. The details of the charges are given below.
    S.No. Particulars Charges
    1 Account Opening Charges FREE*
    2 Dematerialisation charges Rs 500 per certificate
    3 Demat transaction charges Rs 15 + Service tax
    4 Off Market transfer (DP) Rs 25 + Service tax
    5 Inter DP transfer Rs 25 + Service tax
    6 Trade on phone Rs 20 + per executed order plus service tax
    7 Physical contract note / other statements etc Rs 20 per contract note + courier charges
    8 Demat AMC Rs 300 + Service tax
    9 Cheque dishonour charges Rs 200 per instance
    10 NEST Instant fund transfer charge Rs 8 + service tax
    11 Third party fund transfer charges  
      For refund in 2 working days Rs 400
      For refund in 15 working days Rs 200

Key Points to Focus on while Opening a DEMAT Account

At the time of opening your Demat account, you must ensure the following points.

  • Demat account is linked with the trading account to facilitate smooth buying and selling of shares.
  • All the details provided are correct and the nomination (if selected) is correctly mentioned along with the relation.
  • All the upfront and hidden charges are communicated with the broker in advance.
  • The Power of Attorney (PoA) is correctly signed and submitted for allowing the broker to debit shares from your Demat account at the time of selling.
  • Correct communication details are provided since all the necessary updates are shared on your mobile number and Email ID.

The advantage of opening a demat account with TradeSmart

Below are some of the many reasons why a newbie trader or any trader should open a demat account with TradeSmart.

  • Simple And Minimalistic Interface. Easy to understand for new users/beginners.
  • Instant Fund Transfer through Netbanking and UPI
  • Cover, Bracket and After Market hours orders (Advanced order types)
  • 80+ Indicators and Trade From Charts
  • Day And Night Themes
  • Easy IPO subscription
  • Easy and Simple to place and monitor orders, holdings, positions, etc.
  • Single Sign in (No separate login to Back office and access to profile details)
  • Biometric login process so nobody else can get access without your presence.

Benefits of Online Trading

Back in the day when trading had just started in India, the stocks used to be traded in a fashion known as the “Open Outcry system”. This was a system that took place on the trading floor where the person would shout or use hand signals to indicate price changes or buying and selling of shares during market hours. The person interested would approach these people and strike a deal and would take down notes on a slip or form and then after the session they would go back and register all the trades made for the day. The process was cumbersome and exhausting and only those who had access to the building where it happened could benefit from this. However, this has become an outdated process and with the advent of technology, everything has become online. No more shouting or screaming and fighting for getting shares on the market floor.

In the present, online trading has made it easy for the common man to trade stocks with minimal interference from the broker. From websites to mobile apps, trading has become convenient for all with just a few clicks. And this has seen a huge number of participation from all age groups from across the country. So what are the benefits of trading online? I’m sure you can name many yourself but we’ll cover some here as well just in case you may have missed out a point. So let’s go!

What is Online Trading?

Online Trading is the process of trading your stock directly from a website or an app instead of calling the broker or other traditional methods. These platforms are provided by internet based brokers like TradeSmart. It’s very easy to access these platforms as all you need is a good computer system or mobile phone that has an internet connection and you start trading. Basically, you can easily buy and sell stocks from your home or workplace.

The process of online trading

When you place an order online to buy or sell stocks, the process gets executed within seconds. But at the same time, there is a lot happening behind the scenes which help execute these trades in seconds. The process involves.

  • You place and order and it gets registered
  • The order then gets placed in a database
  • It then waits for a seller or buyer depending on the order placed to match its order and when found, a confirmation message is sent to both parties.
  • The order and price is reported to the regulatory bodies
  • The records of the transactions are then stored by the regulatory bodies incase they want to study your past transactions
  • A contract is sent to your broker who sold the shares and to the one who bought them
  • Then the broker has a maximum of 3 days to settle where they exchange the cash and shares
  • The money then gets debited and the shares are officially in your account.

What are the advantages of online Trading?

With technology incorporated in trading, this has brought several benefits. The benefits of Online Trading are as follows:

  • More independence from stockbrokers
    Prior to the online trading era, stock traders would contact their stockbrokers on the phone. While calls were recorded, the chances of human error were huge. While trading something as critical as leveraged stocks, especially over Intraday trading, a single error could cause massive losses.

    In the case of Intraday trading, all you need is that the internet connection should be stable. Rest, everything is on a screen in front of you. Omitting the trader and phone call significantly reduces the time taken and chances of human error.

    Also, when the market is volatile, the dealers of stockbrokers remain busy. That is not the case with online trading. Everything can be managed by the trader instantly at the click of a button.

  • Online Trading is quicker
    Earlier, to trade stocks, you would have to call the stockbroker’s dealers. Then at times, your call would be placed in a queue. After connecting to the broker, you would read the exact details of the stock and sale. With online trading, all this happens at the click of a button. In the case of Intraday trading of even minutes matter for volatile stocks. Thus, online trading is quicker.
  • More exposure to stocks and finances
    In the case of online trading, all stocks and finances are visible on the webpage. You make independent decisions and eventually are exposed to detailed statistics of stocks.
  • Location flexibility
    As of present, most of the reputed trading platforms have apps for phones. This means you can manage your stocks from literally anywhere. All you need is an internet connection. While dealing through an app on your phone, you can trade on the go.
  • Trader gets alerts
    While dealing with stocks by phone, you have to constantly ask the broker for clarifications. In the case of online banking, you can change the settings to get email and SMS alerts. This can help you keep a track of your stock transactions from time to time.
  • You can keep track of stock prices in real-time
    Online trading allows you to deal with stocks in real-time. This means you can check the exact price of the stock on the internet instead of confirming it from the broker every time. Also, since the trading is quick, you would get the stock at the exact price.

    In the case of highly leveraged Intraday trading, even a few minutes of delay could cause losses into thousands or more.

  • Cheaper than phone trading
    Online trading is cheaper than phone trading for both the broker and the trader.  In the case of phone trading, the broker must invest in dealers. This also means the broker will charge a fee from the investor for maintaining the infrastructure.

    This is also the reason most major stockbrokers have created their own online trading platforms. It saves them the cost and saves money for the trader too.

  • Single platform for access to all stock exchanges
    Online Trading platforms allow you to trade across multiple stock exchanges at the same time, mostly through the same website. This means you are managing not only multiple stocks but your assets across multiple stock exchanges from a single computer.

    In the case of trading through the phone, even if your broker allows you this facility, trading across multiple stock exchanges will be cumbersome.

Conclusion

Online Trading is no doubt a way better option than trading on the phone. It saves your time, reduces risk, is more convenient, and saves your money. There is no question on whether one should shift to Online Trading, but one needs to decide which broker to work with. With this technology, opening a demat account also has become faster, simpler and can be done at the comfort of your home.

How to Open Demat Account for Minors?

On investing, Warren Buffett said that he made his first trade at the age of 11 and until then he was wasting his time. The richest investor is driving home the point that it pays highly to start early. Compounding works best with time on its side. 

Unfortunately, in India, we do not teach finance as part of our school curriculum, and parents either end up teaching their children or investing on their behalf. Further, in India, a person below 18 years of age is considered a minor and is not allowed to invest by themselves. 

The minor, however, is allowed to open a Demat account in their name. A Demat account is where shares of the account holder are stored. 

Such an account of a minor will be operated by a guardian. Either of the parents can be a guardian or a court appointed person is eligible to be the guardian when opening a Demat account.

Opening a minor Demat account can help the parents meet the financial goals of the child, like higher education, relocation, wedding and so on.

Also, since the account is in the child’s name, it will give them an insight into the need and benefits of savings and investment from an early age. Not only will it help them become financially literate, but also understand the power of compounding.

Procedure for opening a Demat account

The procedure for opening a Demat account is more or less the same as that for an adult. 

The following set of documents are required:

  • PAN details of minor
  • Proof of birth of the minor
  • Proof of identity of the minor
  • Proof of address of the minor
  • PAN details of the guardian

The requisite form has to be filled by the guardian and KYC verification done for both the minor and the guardian.

Post verification, the Depository Participant will issue a client ID and Account number.


Limitations of Minor Demat Account

The biggest limitation for a minor is that he cannot, on his own, operate the account. 

  • A minor cannot be made a joint holder of a Demat account along with an adult
  • The minor’s Demat account cannot be linked to a trading account
  • The guardian will operate the account till the minor attains maturity, i.e. 18 years of age
  • It cannot be used for any other trading type, equity intraday, equity derivative or currency derivative or commodity trading, for instance

Procedure to be followed once minor turns 18

Depending on the type of account opened, there are two scenarios

  • Scenario 1: where the word MINOR was mentioned
    In such an instance, the existing account has to be closed and a new account opened by the minor who has now turned into an adult
  • Scenario 2: where the word MINOR was NOT mentioned
    The minor who has turned into a major has to fill a new account opening form with updated information.

    Also, he has to fill a new Know Your Customer (KYC) application form or details of KRA registration.

    The account gets updated with details of the new account holder. All the details of the guardian is deleted and the new account holder added.

    Since the account is now being transferred from the guardian to the Minor, the DP will provide a copy of the rights and obligations document to the new account holder and also keep an acknowledgment of the same for record.

Procedure to be followed in event of death of guardian of the minor account holder

In the event of the death of a guardian, the original death certificate has to be submitted to the DP.

The minor’s account will be frozen until a new guardian has been appointed.

The new guardian can resume operating the minor Demat account once KYC, KRA registration and other legal procedures have been completed.

What Are Long Wick Candles? All You Need to Know

In recent years, there has been a significant surge in the number of retail traders. While some traders still depend on fundamental analysis for evaluating investment opportunities, there has been a discernible shift towards the adoption of technical analysis. This methodology entails examining historical price and volume data to predict future price movements, gaining traction, especially among traders concentrating on shorter time frames. Long wick candles have emerged as a key focal point for traders seeking to identify potential price reversals and market sentiment shifts.

What Is a Candlestick?

One of the most prominent techniques in technical analysis is candlestick pattern analysis. While candlestick analysis has always been a vital aspect of technical analysis, it traditionally focused on the body of the candle. However, the wicks or shadows play a crucial role in candlestick patterns, as they indicate significant changes in price levels, representing the high and low of a specific trading session. Wick trading thus revolves around price levels formed outside of the day’s open and close prices, with the length of the wick being essential for determining trading strategies.

A short wick indicates that trading mostly occurred between the open and close prices of the period, whereas a long wick suggests that price movements surpassed or breached the open and close price limits. It’s important to distinguish between a long upper wick and a long lower wick. A long upper wick candlestick occurs when the candle’s high is strong but the closing price is weak, indicating that although buyers attempted to dominate most of the session, sellers ultimately drove the price down. Conversely, a longer lower wick suggests that the trading session ended strongly, with sellers dominating initially but buyers managing to push prices up.

What are Long Wick Candles and How to Identify them?

Trading with long wick candlesticks occurs when prices undergo testing but are ultimately rejected. These wicks signify levels of rejection. Prior to observing a long lower wick, there’s typically a long bearish candle where bears dominate, followed by bulls exerting pressure to reverse the trend upward. As prices start to rise, a pronounced lower shadow or tail emerges, transforming the prior bearish candle into one with a long tail. Conversely, a long upper wick candlestick begins with a bullish candle, but as bears take control, prices decline, revealing a prominent upper wick or shadow.

Typically, the upper and lower wicks of candlesticks aren’t of equal length. However, there are occasions when neither wick surpasses the other. In such instances, the candlestick exhibits a long upper wick and an extended tail, yet the body is small. This formation is referred to as a spinning top, indicating a potential stalemate between bulls and bears, both of whom have been actively trading.

At times, candlesticks may lack any wick or tail altogether. Such candlesticks are known as Marubozu Candlesticks. A red Marubozu occurs when the opening price equals the high, and the closing price equals the day’s low, indicating a bearish sentiment. Conversely, a green Marubozu represents a bullish sentiment, where the opening price equals the low and the closing price equals the day’s high.

These conditions highlight the versatility of wick trading, encompassing not only long or short wicks and tails but also instances with no wicks or equal long wicks and tails. Wick trading holds significant importance as wicks provide insights into supply-demand dynamics, market sentiment, and factors influencing price changes.

Identifying long wick candles involves several key steps:

  • Long wick candles are easily recognizable by their extended candle wicks.
  • Look for candles with long wicks that are notably longer than others on the same day.
  • Identify price levels likely to align with the long wicks, indicating potential support and resistance levels.

Utilize these identified levels in conjunction with the long wicks to assess trade opportunities effectively.

Types of Long Wick Candles

There are two types of long wick candlesticks:

1. Bullish Long Wick Candlestick

This candlestick pattern features a long tail below the body of the candle, typically observed after a prolonged downward trend. Its appearance often signals a potential bullish reversal, indicating a shift towards an upward price movement. This suggests that the security may be reaching a bottom after experiencing a significant decline, with a potential for price appreciation ahead. The extended tail below the body symbolizes efforts by sellers to drive the price down substantially, only to be countered by buyers who demonstrate notable buying strength, resulting in a price rebound.

2. Bearish Long Wick Candlestick


In this candlestick pattern, a long wick appears above the body of the candle, typically occurring after a period of uptrend characterized by a significant price increase. The presence of this long wick can indicate a bearish reversal signal, suggesting that the security may be reaching a peak and could potentially experience a sudden decline in price. The extended wick above the candle’s body signifies that buyers’ attempts to dominate over sellers have been unsuccessful. As a result, sellers are likely to gain momentum and successfully drive the price downwards, leading to a decrease in price.

Significance of Long Wick Candles

Long wick candles are significant because they often signal important price rejection or reversal points in the market. When a long wick forms, it signifies significant price movement in one direction during the trading period, followed by a reversal back in the opposite direction, often erasing most or all of the gains or losses incurred.

For instance, let’s consider a long upper wick candle in an uptrend. This candle indicates that buyers initially drove the price higher, but by the period’s end, strong selling pressure pushed it back down, closing near or below the opening price. This suggests a potential loss of momentum in the uptrend, potentially signalling a reversal to a downtrend.

Similarly, a long lower wick candle in a downtrend suggests that sellers initially pushed the price lower, but by the period’s end, strong buying activity pushed it back up, closing near or above the opening price. This implies a potential loss of momentum in the downtrend, potentially signalling a reversal to an uptrend.

In both scenarios, long wick candles reflect significant indecision or a battle between buyers and sellers at that price level. This serves as a signal for traders to take notice, as it could indicate a potential change in trend direction or the continuation of the current trend, depending on various factors and market context.

Trading Strategies using a Long Wick Candle

1. Reversal Trading Strategy

Traders often use long wick candles as a signal for potential reversals in price direction. For example, after a prolonged downtrend, a long lower wick candle can indicate that sellers tried to push the price lower but were unsuccessful, and buyers stepped in, potentially signalling a reversal to an uptrend. This is because the long lower wick shows that there was significant buying interest at lower price levels, which could lead to a reversal in the direction of the trend.

Traders using this strategy may enter a trade in the direction opposite to the previous trend once they see a long wick candle forming, with a stop-loss order placed below the low of the candle for risk management.

2. Confirmation Trading Strategy

While long wick candles can be useful for identifying potential reversals, traders often look for confirmation from other indicators or candlestick patterns before making a trading decision based solely on the long wick candle. This is because long wick candles, while indicative of price rejection, can sometimes be false signals.

For example, traders may look for confirmation from other technical indicators such as moving averages, RSI (Relative Strength Index), or MACD (Moving Average Convergence Divergence). They may also look for additional candlestick patterns, such as bullish or bearish engulfing patterns, to confirm the potential reversal indicated by the long wick candle.

By waiting for confirmation, traders can reduce the risk of entering trades based on false signals and increase the likelihood of entering trades with favourable risk-reward ratios.

Caution in Using Long Wick Candles for Trading

While long wick candles can provide valuable insights into potential price reversals or rejection levels, it’s important for traders to exercise caution and not rely solely on them for making trading decisions. Here are some key considerations:

1. Market Conditions

Long wick candles should be interpreted in the context of the overall market conditions. For example, during periods of high volatility, long wick candles may be more common and may not necessarily indicate a significant reversal in price direction. Traders should consider the broader market environment before making trading decisions based on long wick candles.

2. Trend Analysis

It’s important to consider the prevailing trend when interpreting long wick candles. A long wick candle may have different implications depending on whether it occurs in an uptrend, downtrend, or in a ranging market. Traders should use trend analysis tools, such as trend lines or moving averages, to confirm the direction of the trend before acting on signals from long wick candles.

3. Volume

Volume is an important factor to consider when analyzing long wick candles. A long wick candle accompanied by high trading volume is typically more significant than one with low volume. High volume indicates strong participation from traders and can confirm the validity of the signal provided by the long wick candle.

4. Confirmation from Other Indicators

As mentioned earlier, traders should seek confirmation from other technical indicators or candlestick patterns before making trading decisions based solely on long wick candles. This helps reduce the risk of entering trades based on false signals and increases the likelihood of entering trades with favourable risk-reward ratios.

5. Risk Management

Regardless of the signals provided by long wick candles or other technical indicators, traders should always prioritize risk management. This includes setting stop-loss orders to limit potential losses and managing position sizes to avoid overexposure to any single trade.

Conclusion

Long wick candles serve as potent tools in technical analysis, signalling robust price rejection or potential market reversals. They offer valuable glimpses into price action, revealing instances where attempted price movements were staunchly rejected, leading to a reversal in the opposite direction. Although these candles can aid in pinpointing potential entry or exit points in trading strategies, it’s imperative for traders to supplement their analysis with other technical indicators and factor in prevailing market conditions for confirmation. Relying solely on long wick candles for trading decisions is ill-advised; instead, traders should adhere to sound risk management practices to mitigate potential losses.


Shares and Debentures – Are They the Same?

If you’ve decided to invest in the stock market and want to increase your wealth then it’s important that you should understand the definitions and differences between the securities that are available to invest in. There are various types of securities like shares, bonds, mutual funds, debentures and currencies and in this particular blog, we’ll focus on shares and debentures. And to hold such securities with you, it is understood that you should have a demat account to conduct trades in the stock market.

Any company or business needs capital to run its operations. For the more established companies, the two most common methods of raising capital is through equity and debt. To raise money through equity, the company issues shares to investors in lieu of the funds invested. To raise debt from the public, the company releases debentures which is like taking a debt from the public and paying a fixed interest on it.

Though both are methods of raising capital, they are very different from each other. What are the differences? Let’s have a look.

What are shares?

Shares are tiny ownerships issued by the companies for the money invested by investors. As an owner, you are holding a part of the company’s equity. Each of these shares gives the holder certain rights and privileges. As a shareholder, you are entitled to receive dividends which are given out by the company at regular intervals. There are two types of shares – preference shares and equity shares.

  • Equity shares: Equity shares are the shares that are sold in the stock market. They allow voting rights to the shareholders. You cannot redeem equity shares, however, if the company decides to wind up its equity, then first once the liabilities are paid, the equity shares are paid to the investors.
  • Preference shares: The preference shares are redeemable and don’t carry voting rights. The company usually offers a fixed dividend on these shares which the company has to pay irrespective of how much profit the company makes. In the case if the company decides to wind up its equity, the preference shareholders will be paid off before paying the equity shareholders.

The price of purchasing these shares vary depending on the market demand and supply and various other factors like company performance, macroeconomic conditions, industrial performance etc.

What are debentures?

When a company decides to raise capital, one method is to issue shares like mentioned above. The way is to take a loan from the public or borrow capital and then promise to pay back with interest. This is done by releasing debentures to the public. It is a long term debt instrument that acknowledges taking a loan from the public. In short, they are taking debt from the public. The debenture holder has no voting rights with the company. Basically, the debenture holder is a “creditor” for the company. But in the case of the company winding up, the debenture holders are given first preference over preference shareholders and equity shareholders since it is obligated to pay its “creditors” first. But since debenture holders are not owners of the company, they do not get any voting rights.

So, debentures are debt instruments sold by the company to creditors to raise debt capital for its projects.

Types of debentures

Like shares, even debentures are categorised into the following types

  • Perpetual debentures – These debentures are like equity shares and do not have any perpetual maturity value. This creates a lifelong stream of income and can be traded in the market like equities.
  • Convertible debentures – These are debentures which have a maturity value and on the date of maturity either can receive the maturity value or convert it into equity.
  • Non convertible debentures – These are traditional debentures that pay out the maturity value with interest and at the end of it, do not allow to convert into equity as well.
  • Secured debenture – these are types of debentures that are issued against some company collateral. This means that if the company is not able to pay back the debt, then the creditors can acquire the asset against which the debenture is issued. This gives a sense of security to the lender at the time of issuing.
  • Unsecured debenture – These are issued without any collateral. But since there is no collateral, the interest rate to pay back the debt is higher and lenders stand a chance to earn more compared to the rest.
  • Redeemable debentures – The principal amount is paid back in a fixed amount of time
  • Non-redeemable debentures – The principal amount is not paid back throughout the lifetime but only at the time of winding up
  • First and second debentures – First debentures are those that are paid over all the others and second debentures are those that are paid after.

The interest rate on paying debentures can be either fixed or floating rate. In the case of fixed rate, the creditors are assured of a fixed rate irrespective of the market conditions and in floating rate, the interest rate varies depending on the market conditions. 

Do note that many times debentures are often mistaken for bonds and are used interchangeably very often but are not the same.

What is the difference between shares and debentures?

The difference between shares and debentures are as follows:

  • Ownership

Shares offer a part ownership of the company. You may or may not get voting rights. In case the company profits, you will get dividends. As for debentures, if you buy you would be a creditor to the company.

Eg. You start a lemon soda business for which you need Rs 1 lakh as capital. You have Rs 25000 only. So, if you choose to add 3 of your friends as your partners to your lemon soda business, it means offering equity shares. On the contrary, if you choose to take a loan from these friends, it means selling debentures.

In the former case, they get a share of the profit when you release the surplus profit. This is called dividends. In the latter case, you pay them a fixed or floating interest.

  • Income

The income through debentures is fixed since it is interest on the invested money. No matter whether the company is in profit or loss, the interest is to be paid. So, your income would be assured. Thus, there’s less risk with debentures, but usually the income is much lower.

In case of shares, the company pays its shareholders dividends. That is if there is surplus profit. The purpose of paying dividends is to boost the confidence of the shareholders and that the returns could be very high, but so is the risk. The returns aren’t fixed.

If you want to play safe, go for debentures. If you prefer high-risk high-return dynamics, then go for shares.

  • Security

Shares offer almost no security. There could be profit or loss. While past data and company reputation could be used for prediction, mostly, shares are a high-risk asset. Even the dividends offered by the company are as per their own accord. One thing you will retain is the ownership of the tiny portion of the company.

In case of debentures, they may be secured or unsecured. This means that the company could offer a collateral, or you might simply consider the debenture over the reputation of the company. In case of a secured debenture, you are safe. In case of an unsecured debenture, your money is not completely safe, but you would usually get a higher rate of interest.

  • Investment confidence

Would a bank give you a loan if your credit history and CIBIL score isn’t strong? Same is the case with debentures. Most investors will prefer to invest in debentures released by high rated companies. One of the reasons is that debentures are mostly unsecured. If the debenture is unsecured, your money is at risk. The debentures of reputed companies sell like hot cakes as chances of paying back the money is good, whereas those of less reputed companies don’t find many takers.

In case of shares, investors prefer to rely on graphs, prediction, history, etc and not just the overall reputation. The loan repayment history is rarely checked as far as the company’s profile looks strong.

  • Voting rights

In case of shares, you may or may not get voting rights in the company depending on the type of shares. Unless you have significant stock percentages of the company, the voting rights might not matter much. Nonetheless, you are a part of the company.

In case of debentures, you get no voting right. You are simply a person who lent a loan to the company and got an interest for it. Period!

The difference can be summarised in the table given below.

Differentiator Shares Debentures
Meaning Owning a portion of the company’s capital Long term debt instrument issued under the company’s name
Nature of instrument Owned capital Borrowed capital
Investors Holders are part of the company Holders are creditors to the company
Liquidation Given last priority Given first priority
Returns Returns in the form of dividends and capital appreciation Returns in the form of interest
Voting rights Are given in case of equity shares Are not given at all
Security Unsecured. Depends of market movements Are unsecured in nature but payments are guaranteed irrespective of market movements

Shares or Debentures – The better investment?

While planning investment, the wise thing to do is to secure your money first. Then raise capital, and then risk your money. Unlike fixed deposits, debentures offer a much higher level of interest. Unless you have significant capital to risk, debentures should be the choice of investment.

If you have significant capital, have secured your money, and are interested in growing your money much faster, then shares are the thing for you. However, make sure to follow discipline while investing in shares. Sometimes a small win can tempt you into huge losses.

While both instruments have their pros and cons, it is up to you to decide where you want to put your money depending on your risk tolerance.

What Is a Contract Note? How to Read It?

Since the onset of the pandemic, the number of retail investors has seen a huge rise. Thus possibilities of conflicts are also increasing day by day.  The Securities Exchange Board of India (SEBI) has taken a lot of measures to safeguard the interests of retail investors. One of these is done by issuing contract notes, showing the price, brokerage, GST, and securities transaction tax (STT) in the prescribed format. 

Contract notes are easily one of the most relevant legal documents available to investors and traders in the stock market. It shows in detail all transactions which took place in a day in one place, along with profit and loss information. It is a legal record of any of the trades made by a trader on a stock exchange. It records and confirms the trades taken place on a particular day, performed on a stock exchange (BSE or NSE). This document is sent to the trader by the broker, listing out the details of the shares bought and sold through them. This document is generally available in an electronic form.

Contents

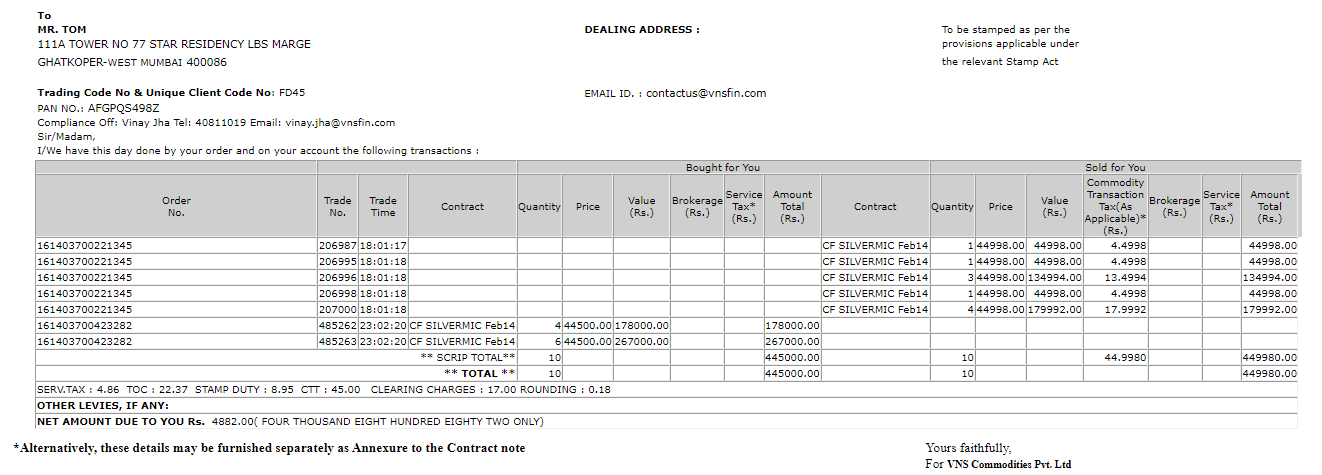
A contract note gives traders and investors a basic description of the trades they have taken, along with the date, period, lot size, or quantity traded. It also gives the trader a reference number with which they can cross-reference their transactions with the stock exchange.

Contract Notes usually consist of the following:

  • Order Number & Trade Number: This column accounts for the distinctive numbers given by Exchanges to specific Orders and Trades.
  • Order Time: the precise time at which an investors Order was placed on the Exchange is highlighted here.
  • Trade Time: The time at which an investor’s trade was successfully executed on the Exchange comes under this column.
  • Securities/Contract Description: Refers to the name of the stock/contract that was traded.
  • Buy/Sell: basically refers to the sort of order placed by the trader or investor.
  • Exchange: This column lets you know on which exchange your trades took place. That is NSE or BSE.
  • Quantity: This accounts for the quantity of stock an investor trades in. Positive numbers apply to buy orders while negative (-) numbers apply to Sell Orders.
  • Gross Rate per Unit: This rate highlights the price at which an investor’s order got executed on the Exchange.
  • Brokerage per Unit: Brokerage charged for each trade is mentioned in the next table.
  • Net Rate per Unit: As brokerage charges are mentioned separately, net rate per value adds up to the same value as gross rate per unit.
  • Closing Rate per Unit: These are applicable only to derivative trades, this rate accounts for the price that the specific contract closed for the day.
  • Net Total before Levies: This refers to the whole amount before any of the other charges can be added. A positive (+) amount denotes that an amount is owed to you. Whereas a negative (–) amount denotes an amount you owe.

While the first table provides you with comprehensive details, the following table gives you a breakup of the summary of the charges.

  • Pay In/Pay out Obligation: This is the summation of the amounts owed to you (positive), or the amounts you owe (negative), before the deduction of levies and taxes.
  • Taxable Value of Supply: This tells you the total of brokerage that is chargeable as per your brokerage plan, plus the Exchange Transaction Charges, which is a fee by exchanges like NSE, BSE, MCX, and NCDEX, in order to enable the trader to trade. 
  • Securities Transaction Tax (STT): This is the direct tax chargeable on each trade taken on the exchange,, which gets collected by the broker and paid to the respective exchange. STT is levied on every trade taken be it buying or selling and on equity delivery, and on selling on intraday and F&O.
  • SEBI Turnover Fees: The Securities and Exchange Board of India (SEBI) charges a fee on securities transactions made by traders in order to regulate the market.
  • Stamp Duty: this is a Government levy applicable on transfer of securities like shares, debentures, futures and options, currency, commodities, and various other capital assets.
  • Net Amount Receivable by Client / (Payable by Client): This column denotes the total amount to be paid or received by the client after all levies and charges. A positive (+) amount denotes that an amount is owed to you, while a negative (–) amount denotes an amount you owe.

 Sample of a contract note issued by TradeSmart

Importance of Contract Notes

As there has recently been a huge increase in the number of participants in the stock market, the odds of disputes are also rising at a similarly increasing rate as days go by. SEBI has taken a few steps to shield the retail investors. One of the first actual steps on this course is the digital contract note in the prescribed format showing Price, Brokerage, GST, STT etc. By perusing this report thoroughly, an investor can be confident that the order he has placed with his broker has been executed correctly. This report is a prerequisite for submitting a grievance against your broker, you must always insist on regular delivery of contract notes from your broker.

Just by glancing at this report, an investor can be assured that the order he executed through his brokerage was carried out efficiently. Contract Notes can act as a ready reference in case of doubt with reference to any transactions as you can guarantee the genuineness of the same on the BSE/NSE website. The most common use of a contract note is:

  • Computation of Capital Gains,
  • Calculation of overall brokerage charged,
  • Calculation of details for submitting Income Tax Return,
  • Cross verifying genuineness of the transactions
  • Legal Proof in case of dispute with broker.

In summation, contract notes offer investors a summary of their trades taken on a specific day. Additionally to those trades, they’re given an overview of their profits or losses. Contract notes are provided in an electronic format with a digital signature of the authorized signatory of the brokerage firm.

Basic EPS vs Diluted EPS

To anyone who is new in the market and learning the concepts, you must have heard of the word EPS which is nothing but Earning Per Share. It is an important financial measure which indicates the profitability of a company. It indicates how much a company makes for each of its stock and is a widely used metric for estimating corporate value. Let’s learn more about it and its type in detail.

What is EPS?

Earnings Per Share, or EPS is an important financial tool which shows the profitability of the company. When EPS is spoken about, it is generally either Basic EPS or Diluted EPS. Basic EPS is calculated by dividing the company’s net income by its total outstanding shares during a given period. The formula to calculate is given below

Basic EPS = (Net Income – Preferred Dividend)/ Outstanding Common Shares

Diluted EPS takes into consideration all the potential dilution which could take place due to stock based compensation,and convertible securities. Diluted EPS can be calculated by subtracting preferred dividends from a company’s net income and dividing this by the number of outstanding and dilutive shares. The formula is mentioned below.

Diluted EPS = (Net Income + Convertible Preferred Dividend + Debt Interest) / All convertible securities plus common shares.

Basic and Diluted EPS are similar in nature, but differ on principle. Basic EPS is a simple measure of profitability and hence it is a more easily understood, even by new investors.Whereas diluted EPS is a more complicated technique. Most new investors find it difficult to understand diluted EPS.

While basic EPS is simpler, it is not a very practical and realistic approach to calculate the value of a company. Diluted EPS gives a more pragmatic approach and explanation of how the company is performing based on the capital deployed after taking into consideration dilution of securities. It is not ethical for companies to issue preference shares, or convertible preference shares without showing their potential for dilution.

The calculation of diluted EPS is quite an intricate process and requires a lot of data. Basic EPS is easily computed by finding the difference between net income and preferred dividend, and then dividing the same by outstanding equity shares. The calculation of diluted EPS requires identifying all potential shares and financial instruments that can result in more shares in the future. These include the following

  • Stock options and warrants
  • Convertible bonds
  • Convertible preferred shares

Diluted EPS is computed by totaling the sum of net income, convertible preferred dividend, and debt interest, and dividing the same by outstanding shares plus the effect of dilution as an impact of convertible securities of the company.

Basic EPS ideally works for small companies whose capital structure is fairly simple. When a company does not have convertible preference shares, or other prospective diluters, then basic EPS will suffice. Conversely in larger companies, who have a more intricate capital structure, and high potential for dilution in the form of convertible preference shares, diluted EPS is the preferred method that should be followed.

Practical Application of Basic EPS and Diluted EPS

Calculation of EPS is one of the basic steps to calculation of the Price to Earnings Ratio (P/E Ratio), it helps in the valuation of the company. Therefore the more in depth and accurate the EPS, the better it is.

Basic EPS is a good estimate of a company’s current profitability, while diluted EPS is more scientific and pragmatic, and it makes a provision for potential dilution, so that there is no misrepresentation of the books to the shareholders.

From a practical aspect, the diluted EPS is more prudent as it takes into consideration the potential impact of dilution of convertible shares and securities.Thereby showing a more complete EPS value, and that in turn gives a more efficient P/E ratio.

Where basic EPS assumes only issued, and outstanding shares of  a company, the diluted EPS takes into consideration the potential impact of common share price, preference shares,stock options, partially convertible debt, and fully convertible debt.

What are the key differences between Basic EPS and Diluted EPS?

  • Basic EPS is a simple method of calculating the profit of the company. Diluted EPS is a complex measure.
  • Basic EPS is the preferred method to find out the financial position of a company, but it is not completely accurate. Diluted EPS is a more complicated but truer method to calculate the financial position of a company.
  • Basic EPS can be easily calculated by deducting the preference dividend from the net income, and dividing the result by the amount of outstanding equity shares. Diluted EPS on the other hand, has a complex formula, and can be calculated by adding net income, convertible preference dividend, and debt interest, and dividing this by outstanding shares plus all convertible securities of the company.
  • Basic EPS is generally used by companies who have a simple capital structure, whereas diluted EPS is used by companies who have complex capital structures.
  • Basic EPS does not take into consideration that any shares have been added to the existing amount of shares through a stock split. Diluted EPS betters basic EPS by including potential dilution of convertible shares and securities.


The difference can be summarised in the table below

Basic EPS Diluted EPS
Only basic earnings of the company per equity shares Revenues of the company for every convertible share
Helps in evaluating the profitability of the company Helps in assessing the profitability of the with convertible securities
Not accurate as it does include convertible shares More thorough and detailed in nature
Common shares included in calculation Common shares, stock options, preferred shares, debts, warrants all included in the calculation
Easy to understand and use More complex and detailed to understand

Conclusion

Investors buy shares of companies in order to earn dividends and so that they can sell the shares at a higher price in the future. The EPS of a company determines the dividend payments, and the value the share is trading at. Therefore the EPS is a very essential tool to retail investors.

Prospective investors need to be aware of which method of calculation of EPS will be mentioned in the financial statements of the company and how it affects the company. Knowing the difference between basic and diluted EPS is essential to prospective investors, so that they can make good investment decisions.

Scalping Indicator

A majority of people find intraday trading intimidating. They often can’t figure out their style of trading that best benefits them. It is important to figure out the technique you need to adopt that best suits your financial goals, risk appetite and time you spend in the stock market. For some it serves as a good source of additional income while there are those who use it as their main source of income. The latter are those people who are very experienced with trading and are well learned in various advanced trading strategies. Scalping is one such style of trading that many adopt. It gives a good feel of trading and you can also earn quick profits using this method.

And in order to master this technique of trading there are several indicators to help out. But first it is imperative that you understand the meaning of a scalper and its details before jumping to the indicators.

Who is a Scalper?

Scalping  is a method of trading in which traders book profits in small changes in price. A scalper is a person who enters and exits the trades in financial markets extremely quickly, usually within seconds, using a higher margin to place a large volume of trade so that they can achieve great profits from tiny changes in the markets. Their exit from the market is pre-planned since they trade in such a way that a single loss can eliminate all their small gains.

Scalpers buy and sell several times in a day with their main objective being to make consistent profits from minor changes in the price of the security they are trading.

Scalpers usually view charts in a shorter time frame, such as one, three, and five minute time frames, to make their trading decisions. With the help of several different technical indicators to predict minor movements in price. 

Traits of a Scalper

Scalpers are of the belief that it is easier to make small profits off the market since there is a lot of volatility and can’t afford to take too much risk. They grab small moments when there is a profitable trade before it vanishes. Unlike many who buy shares for the long term, these guys rely on trading within minutes. And this has led to certain characteristics about scalpers which can be listed below.

  • Disciplined

    Scalpers need to be extremely disciplined. They must follow their trading plan to the T, if they are to succeed. Scalpers generally set a daily loss limit, and refrain from trading if that point is breached. This prevents revenge trading.

  • Combative

    Scalpers are generally warriors by nature. They view the stock market as a warzone and consider other traders as the enemy.

  • Decision Making

    As scalping is a very quick process, the scalper should be extremely quick and have to make important decisions within a matter of seconds, or they might miss opportunities. They also need to make quick decisions to recover from wrong decisions. Being a good decision maker is an essential skill that every scalper should have, it helps them remain calm and composed in dire situations.

Advantages of Scalping

Since scalping yields a short burst of profits, it has a few benefits which are mentioned below.

  • Lower Risk Exposure

    The short holding periods of scalping ensure that your risk is limited.

  • Potential for Higher Profits

    There is good potential to earn more profits from scalping as it does not depend on big market movements.

  • Allows Multiple Trades

    Scalping allows you to take multiple entries into the same trade during the day, as the opportunity presents itself.

  • No Requirement of Fundamentals

    As the trades will be held for a short period of time, there is no need to have a fundamental knowledge of the asset being traded. Only a deep knowledge of technical analysis is required.

Disadvantages of Scalping:

  • Requires a lot of Effort

    Scalping is a tough task which requires you to have a good knowledge of technical analysis, and also requires you to have great concentration and patience. 

  • Expensive

    Scalping requires you to take multiple trades, whose cost can eventually add up to a big amount. And the stakes are such that one big loss can wipe out all the small profits earned over time.

  • Time Consuming

    Scalping is a time consuming process, and requires the trader to spend long hours in front of the screen. It demands your constant attention as you cannot afford to miss out even a single opportunity to make a profit.

Most Commonly used Scalping Indicators

Now that you’ve understood what scalping is and who a scalper is, and if you are still keen to master the art of scalping and learn the in depth functioning of the market then following indicators will help you

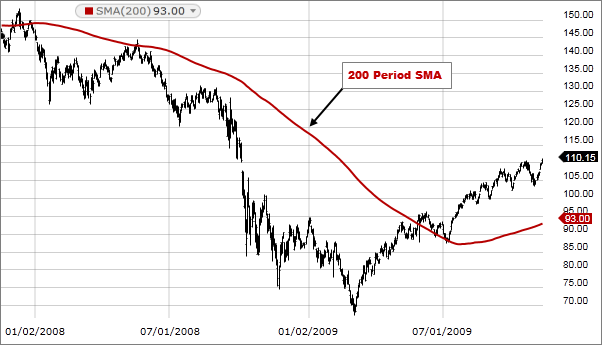
  • The SMA Indicator

    SImple Moving Average, or SMA is one of the basic scalping indicators that most traders use. It uses basic arithmetic, and shows traders the average price of the security they are trading in. It helps in identifying the market trend, whether upward or downward. It is calculated by adding the closing prices in the desired time frame, and then dividing the number by the number of periods.

SMA Indicator

Source: Fidelity


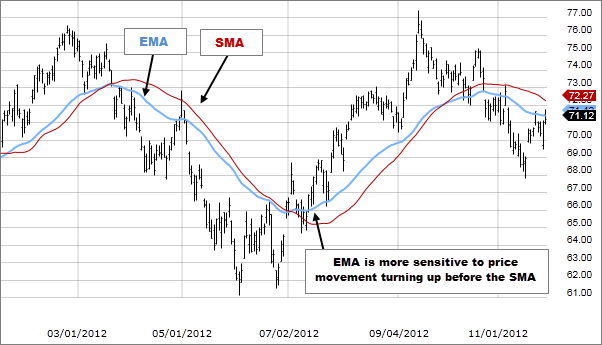
  • The EMA Indicator

    The Exponential Moving Average, or EMA, is yet another useful moving average indicator. This indicator gives preference to the recent price. When compared to SMA, the EMA provides detailed information on price a lot faster. And while the SMA gives preference to overall weights, the EMA gives preference to recent price.Hence EMA reacts more quickly to recent price than to overall price.

EMA Indicator

Source: Fidelity


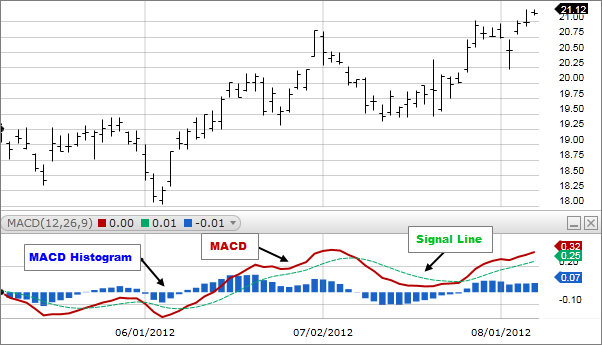
  • The MACD Indicator

    Another common indicator used by scalpers is the Moving Average Convergence Divergence Indicator or MACD. It not only helps the trader understand momentum, but also assists in following and capturing market trends.One of the key features of this indicator is that it shows the relationship between two moving averages of a securities price.It can be calculated by minusing the 26 day EMA from the 12 day EMA, while the 9 day EMA is the default setting for buying and selling orders.

MACD Indicator

Source: Fidelity


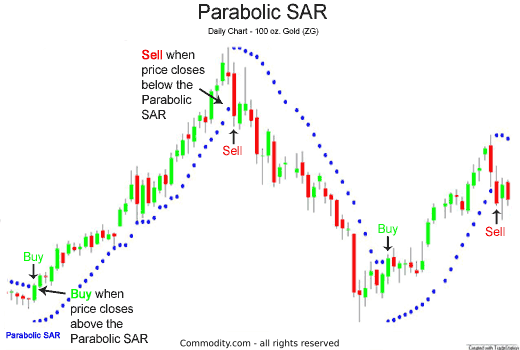
  • The Parabolic SAR Indicator

    The Parabolic Stop And Reverse or SAR indicator helps traders to get detailed information on price action trends.The concept behind this indicator is that when the position of the SAR is above the price, it is a down trend, and if the position of the SAR is below the price, it is an uptrend. The Parabolic SAR allows you to find out the short  term momentum and trend of any security. Hence it is a great tool for scalpers. A possible disadvantage of the PArabolic SAR indicator is that it can sometimes show false breakouts,which can mislead traders.

Parabolic SAR

Source: Commodity.com


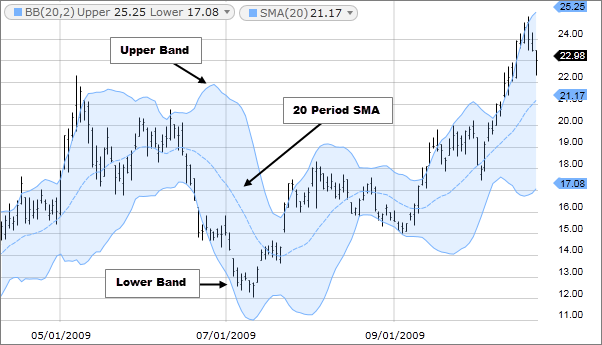
  • Bollinger Bands Indicator

    Bollinger bands are a trading tool used to determine entry and exit points in a trade. They can also show overbought and oversold conditions. They also show the volatility of an instrument. They consist of three lines, the middle band is the 20 day simple moving average, the top band is calculated by adding twice the daily standard deviation to the middle band, and the lower band is calculated by the twice the daily standard deviation subtracted from the middle band. A trader would generally take an entry when the price is near the bottom or the middle band, and exit once it reaches the middle or the top.     

Bollinger Bands Indicator

Source: Fidelity


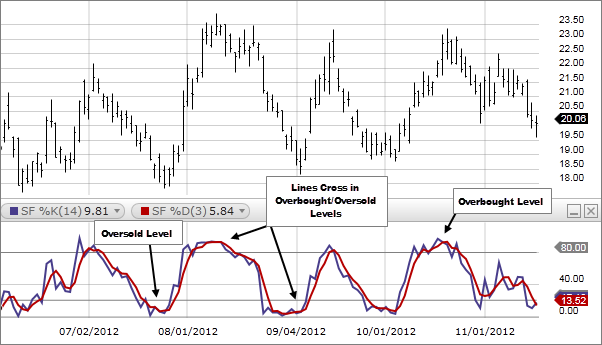
  • The Stochastic Oscillator Indicator

    This indicator can be used to trade across forex, indices, equity, and other securities as well. In spite of having such a wide range of applications, it can be used as a good scalping strategy. It follows the concept that the price of the asset is decided by the momentum So it basically allows traders to know what is about to happen right before it actually does. This is one of the most reliable scalping tools.

Stochastic Oscillator Indicator

Source: Fidelity


How is Scalping different from Day Trading?

The difference between the two can be summarised in the table below:

Day Trading Scalping
Trader uses a time frame of 1 – 2 hours Trader uses a shorter time frame than day trading which ranges from 5 seconds – 1 minute
The account size is average The account size is larger since scalp trader takes higher risks
The returns are expected by the end of the day The returns are expected immediately after the trade has been executed
Traders usually follow trends and take decisions based in technical analysis Traders don’t look for ant trends and rely on their own experience in determining where the trend is heading

In conclusion – should you scalp?

One thing that must be remembered is that there are several scalping tools available to traders. The ones listed above are some of the more popular ones, as well as user friendly ones. Some of these indicators can be used together, as well as with other indicators, however as the saying goes, too many cooks spoil the broth, so we must not over use the indicators as this could lead to confusion.

While these indicators might seem easy to use at first, it can take a while to fully find the right combination of indicators, and master them completely. It is suggested that you adopt this style of trading only if you’re a veteran in the field of stock trading and can afford to take really high risks.

Intraday Trading Tips & Strategies and Basic Rules

Day trading has come into great demand ever since the pandemic began. As most of us have been working from home, we save a lot of time on daily commutation. With markets touching lifetime highs and having spare time at our hands, many learned the skill of intraday trading and have been profitable day traders.

Although, many of you must be finding something missing in your trading regime, right? If you are an intraday trader and are looking to improve the chances of success in the stock market, then you are at the right place. In this blog, we will share with you some interesting tips and tricks about intraday trading that will not only enable you to trade confidently but also help you ace the game in the long run.

So without further ado, let us begin with a few intraday trading rules that you must follow.

Intraday Trading Rules

The stock market is a boundaryless environment. There is no limit on how much you can make from the market, and at the same time, there is, practically, no limit on how much you can lose. Therefore, to operate successfully in such an environment, you need to function within a predefined set of rules to protect yourself from falling into the trap of greed and fear.

Here is the set of intraday trading rules which will protect you from the stock market’s unpredictability and help you become a long-term trader.

  • Rule 1: Trade at specific times

    Intraday trading is all about catching the right momentum. Markets open at 9:15 AM and close at 3:30 PM. But throughout the session, there are certain times when markets pick momentum. The rest of the time, prices either do not move much or act very volatile. You can avoid such times. The best time for intraday trading is from 9:30 AM to 11 AM and then from 1 PM to 2:30 PM.

  • Rule 2: Trade as per your Setup

    Firstly, you must have a setup that allows you to enter and exit a trade for certain reasons. Never enter into a trade randomly. With a proper setup, you can trade with confidence. You must always follow the trigger points of your setup and place buying and selling orders when it is triggered.

  • Rules 3: Never keep a Hope

    This is contrary to what we follow in real life. In the stock market, hope is a bad thing. Let us take an example to understand this rule. Suppose, a buy signal was triggered on your setup and you bought the shares at Rs. 550. Your target was set at Rs. 560 but the price moved up to Rs. 555 and your setup shows a sell signal there. You must exit your position at Rs. 555 and not hope for the price to reach your target against the sell signal. More often than not, you end up taking a stop loss in such scenarios. So you must avoid keeping hope as much as possible in intraday trading.

  • Rule 4: Scale up your position gradually

    In the beginning, you must keep the quantity very small. As you gain confidence about your setup and start to make a consistent profit, you can start to scale up the position. If you begin with a large position, then the losses can be large which can deplete your capital and confidence. You must always build your capital and then scale up.

  • Rule 5: Trade only in Liquid and Volatile shares

    To be able to buy and sell the shares on the same day, there must be liquidity in them. Meaning, more buyers and sellers must be active in the share. Otherwise, if you buy the shares, it becomes difficult to find sellers at the target price in illiquid shares. That makes you execute the sell order at lower levels, eventually reducing your profits.

  • Rule 6: Square off your trades before 3:30 PM

    Many novice intraday traders make the mistake of carrying forward their trade to the next day by converting the position from intraday to delivery hoping that the target price will be achieved the next day. More likely, the price goes below on the next day as well increasing the loss. Therefore, if you choose to become an intraday trader, you must stick to it and square off all the trades before 3:30 PM, regardless of profit or loss.

  • Rule 7: Continuously scan the market

    If you have made a list of liquid shares that you regularly want to trade in, then you must scan all those shares throughout the day to look for any opportunity in them. If you have not made such a list, then you must make one. It enables you to stay focused and not feel lost during the trading session. Trading is a job that demands very few working hours but you need to be continuously present at your trading terminal, scanning for trades during those hours.

Following these rules will keep you on the right track to becoming a successful intraday trader. You can note them down somewhere to revisit these rules time and again to ensure that you are following them religiously.

Target and Stop Loss

Talking about the target and stop loss in intraday trading is very important as many do not understand the potential of making small wins consistently. You must never aim for huge returns in intraday trading because even a small percentage of gain gives a high return on investment in day trading.

Here’s an example to understand this.

Suppose you buy 200 shares of Company LMN at Rs. 100 per share. Since intraday trading has the benefit of margin, you will not have to pay the whole amount of Rs. 20,000 (Rs. 100 x 200 shares) for this trade. Let’s assume that Company LMN shares have a 5x margin. That means, you only need a capital of Rs. 4,000 (Rs. 20,000 ÷ 5) to enter into this trade.

Now, if you set a target of Rs. 104 and stop loss at Rs. 98, then, you have a chance of earning Rs. 800 (Rs. 4 x 200 shares) at risk of losing Rs. 400 (Rs. 2 x 200 shares).

Even with a small target of Rs. 4, you have a chance of earning 20% ROI (Rs. 800 ÷ Rs. 4,000). But you must also remember that the stop loss is very crucial. In this trade, if the price moves in the other direction, you could lose 10% (Rs. 400 ÷ Rs. 4,000) of your capital.

Therefore, setting a small target and small stop loss is important in intraday trading. Most experts make small profits consistently making the most out of high ROI. But the risk factor on intraday trading should never be neglected. Here are some dos and don’ts that will help you further brush up your intraday skills.

Other Important Tips and Strategies for Intraday Trading

  • Technical Indicators

    As intraday trading is mostly based on technical analysis, using an indicator that suits your trading setup can improve accuracy and help you avoid entering into wrong trades.

  • Small Time Frame Charts

    The stock charts are available in various time frames starting from 1 minute and going up to 1 month where each candle represents the selected time frame. For intraday trading, you must stick to smaller time frames, from 1 minute to 15 minutes.

  • Multi Time Frame Analysis

    You can select shares based on a 1-day time frame the previous day and while trading, you can wait for trade confirmation on a small time frame chart. This helps you catch trades with high probability. With practice, you can analyze a share on multi time frames with ease.

  • Avoid Trading in the first 15 minutes

    First 15 minutes, from 9:15 AM to 9:30 AM, the trading is mostly emotion-based. The market reacts to the previous day’s news in the beginning and later, the day’s trend starts to form. Therefore, you must wait for 15 minutes before placing a trade.

  • Aim for a Higher RR Ratio

    RR ratio stands for risk-reward ratio. You must always define how much risk you can take to earn a certain amount of reward. Ideally, if you plan to risk Re. 1 on a trade, then you must aim to earn at least Rs. 2 to Rs. 3 from that trade. Needless to say, you must always aim to earn more at the least possible risk.

In a nutshell

Intraday trading is all about making small wins with smaller risks. Day trading aims to end the day in green even if it is to earn a small amount. With leverage, the return on investment in intraday trading is higher, which is what attracts many traders towards intraday. Apart from following these tips and tricks, choosing the right platform also plays a key role in your trading journey.

If you are looking to open a trading account for intraday trading, you must check out TradeSmart’s Sine platform which provides a solid trading terminal with 80+ technical indicators to help your trading setup. Apart from that, TradeSmart also provides margin trading facilities. You can check out the margin available for intraday here. You must also be aware of the fact that using an intraday margin is like playing with a double-edged sword. While you can make the most out of it if you know the right way to do it, if you make a mistake, the cost is high as your losses also magnify.

Difference Between Intraday & Delivery Trading

The stock market is a versatile marketplace where multiple financial products are available for all types of traders and investors. Some prefer short-term trading whereas some prefer long-term trading or investing. The stock market has something for everyone. Investors hold their investments intending to create wealth and grow with the company. Investors are in no hurry to sell their investments and book their profits.

Traders, on the other hand, book their profits from time to time. Based upon when the profit is booked, the traders’ activities of buying and selling can be categorized into two types, intraday trading, and delivery trading.

Let us look at both types in detail along with their advantages and disadvantages and understand how these trades need to be approached.

What is Delivery Trading?

When you buy the shares on a delivery basis, you can hold them for as long as you want. You become the rightful owner of those shares. You are also entitled to the dividends, rights issue, and bonus issue declared on those shares. The shares delivered to you are deposited to your DEMAT account upon purchase. The DEMAT account works as a safehouse of all the shares you’ve purchased and taken delivery for.

The targets in the case of delivery trading can be higher as there is ample time for the price to move higher. The trader has to make full payment for the value of the shares purchased. For instance, if you buy 100 shares of Company B @ Rs. 120 per share, you have to pay Rs. 12,000 at the time of purchase. There is no concept of margin in the case of delivery trading.

Let us dive deeper more by knowing the pros and cons of delivery trading.

Benefits of Delivery Trading

Some of the benefits of delivery trading are mentioned below.

  • Ample Time Available

    As a shareholder, you are free to hold on to your shares for as long as you like. If the shares do not perform well in the short term, then it is not necessary to book losses immediately. If there is a possibility of shares performing well over the long term, then you have the choice to hold on to the shares.

  • Limited Losses

    Since there is no margin money involved in delivery trading, the maximum loss is limited to the sum paid for buying the shares. In the case of margin, the loss can be higher.

  • Dividend income, Bonus Shares, etc.

    Since you own the shares, you are eligible to receive dividends declared by the company. Any bonus shares declared by the company also get credited to your DEMAT account.

Shortcomings of Delivery Trading

Let us also look at some of the cons of delivery trading.

  • Capital is Blocked for a Longer Period

    Since the benefit of margin is not available in delivery trading, the capital invested remains blocked unless the shares are sold. This impacts the liquidity.

  • Leverage is not available

    As we discussed if you buy 100 shares of Rs. 120 each, you need to pay the full capital of Rs. 12,000 to buy the shares. No benefit of leverage can be availed by the delivery trader.

To understand the difference between the two types of trading, let us go through the intricacies of intraday trading.

What is Intraday Trading?

An intraday trade is a transaction where you sell or purchase a share within a trading session. Intraday trades are executed through a different set of orders. The traders executed via intraday orders are meant to be squared off by end of the trading day. If you voluntarily do not exit the position, your broker can square off the open trades at a price available at the time of closing. You should check with your broker about this process.

If the share price is below the target selling price, they buy the shares. When the price reaches their target levels, they sell the shares and book their profits for the day. If the price does not reach their target prices, then at the end of the day, they anyway have to sell the shares at whatever best price is available. Let’s take an example for a better understanding.

Suppose, Miss A sees the opportunity to buy shares of Company Z @ Rs. 240 at 10 AM with a target price of Rs. 250. Now if she buys the shares and the price reaches Rs. 250 at 12:30 PM, Miss A will sell the shares and book her intraday profits. If the price of Company Z shares does not reach Rs. 250 but trades between, say Rs. 246 and Rs. 248, for the rest of the trading session, she will have to exit at whatever the best price is available before the market closes at 3:30 PM.

Does that sound tempting? Well, you must look at the pros and cons too before you jump to any conclusion.

Benefits of Intraday Trading

Here are some of the benefits of Intraday trading.

  • Smaller Capital Requirement

    Margin funds are used by intraday traders to take positions. You can use margin for a larger trade without paying much in advance.

  • No-Risk of After Market News

    As the positions are squared off on the same day before the market closes, there is no impact of any news that comes in later. You can start fresh the next day.

  • Liquidity is Higher

    The short timeframe allows traders to liquidate their positions in a single day. It’s also beneficial for traders as it allows them to book profits quickly.

Cons of Intraday Trading

There are some shortcomings to intraday trading as well. Let us look at them.

  • Demands Complete Attention

    You must keep track of the movements of markets to position yourself for optimal profits. This discipline is very different from other forms of trading.

  • No Dividends, Bonus, or Rights

    Unlike other forms of trading, intraday traders do not own shares. This means they do not have the rights and privileges that come with owning shares.

Now that you know both the types of trading in detail, shall we go ahead and understand how each of them must be approached? Let’s find out.

How should you approach Intraday & Delivery trades?

The way you approach intraday trading vis-a-vis the way you approach delivery trading is completely different. These three main elements make a major difference.

  • Liquidity

    As intraday trades need to be squared off the same day, the share must be liquid enough. In the case of delivery trading, there is ample time after buying to wait for the target. Therefore, liquidity is not a problem for delivery trading. The best way to find out whether a share is liquid or illiquid is to look at the trading volumes. The higher the volume, the liquid the share is.

  • Volatility

    Again, in the case of intraday trading, the prices need to pick momentum to reach the target. If the price trades within a range throughout the trading session, an intraday trader can never make money. Therefore, intraday traders pick volatile shares. Mostly, shares with high volume, large-cap shares, shares of companies with some newsflow, etc. are more volatile. For delivery trading, prices have enough time to make the move towards the target.

  • Research, Study, and Tools

    Before entering into any trade, extensive study is important. Experts use tools like charts and indicators to conduct technical analysis for intraday trading. On the other hand, for long term delivery trading, they study the fundamentals by going through the financial statements of the company, reports on industry performance, conducting ratio analysis, etc.Apart from these factors, risk management also differs in both types of trading. Therefore, you must analyze each trade carefully in terms of both, profit and loss, before executing.

The Bottom Line

To be able to achieve long-term success in trading, you must choose the type that matches well with your personality and meets your requirements. Trading is a long-term business and without proper risk management, it can get difficult to survive in the stock market. Along with that, you also need a stable platform to execute your trades.

You can check TradeSmart’s trading terminal with extensive features that allow smooth execution of both, intraday as well as delivery trading. Apart from that, TradeSmart provides the lowest brokerage in India at Rs. 15 per order or 0.007%, as per the plan you choose. You can check out more details here.

Open Demat Account With TradeSmart

Lowest Brokerage Ever Trade @15 Per Order
Download TradeSmart App Now

Scan below QR Code
to download App

Open Demat Account