How To Read Option Payoff Charts & Diagrams
Pay-off diagrams
A diagram is a graphical representation of any information. A pay-off diagram is nothing but a graphical representation of the profit or loss profile of an option. Understanding the profits and losses of complex option strategies can be difficult without a tool. Option strategies have multiple legs of buying and selling options. This results in some making profits and some other options making losses. It is a tedious job to aggregate the profits and losses and monitor the strategies manually. Pay-off diagrams as a tool help in visualising this. A pay-off diagram not only gives the current profit and loss of an option position or an option strategy at various price levels at expiration.
How to read pay-off charts
Every option has a pay-off chart. A call option will have a pay-off chart, a put option will have a pay-off chart and a combination of puts and calls that make a strategy will also have a payoff chart.
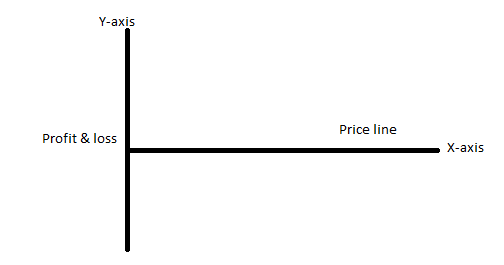
Pay-off charts are very simple to understand. A graph as we know has X-axis and Y-axis. The price is plotted on the X-axis while the profit & loss is plotted on the Y-axis. The zero line or the price line on the graph is also the breakeven or no profit lo loss line.
There are four possibilities in options trading- long call, short call, long put and short put. Each of these will have a pay-off diagram.
Pay-off diagram for a long call
A long call option means the market is expected to go up. There is also a cost that is paid in the form of a premium. Therefore, the breakeven for a long call would be the strike price plus the premium paid. For example, a call option is bought with a strike price of 15400 at an Rs.201.7 premium. The breakeven of the call option will be 15601.7 (15400+201.7). Since the lot size of Nifty is 50 the outflow is Rs.10,085. The spot price at the time of buying call was Rs.15461.15. Let us see what the pay-off looks like.
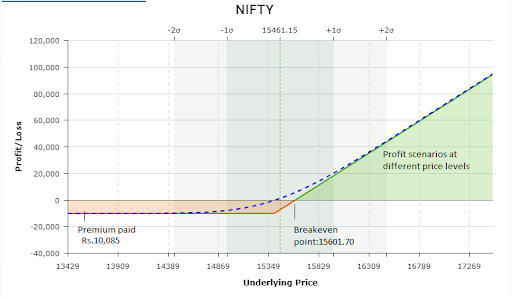
In a long call, the profit can be unlimited as the market can go up to any high and the loss can be limited to the extent of the premium paid. In the above pay-off, we can see that the green shaded area shows the profit scenarios at different price levels on expiration. The maximum loss area is the light orange shaded area which is the premium paid. The dotted blue line is the pay-off for today.
Pay-off diagram for a short call
A short call means expecting the market to fall. Since you are selling or writing a call you are assuming somebody’s risk. He is paying a premium and you are collecting a premium i.e., and income you pocket. Therefore, the income would be limited and the risk would be higher. The breakeven will be the strike price plus the premium received. For example, a short call position is created at a strike price of 15400 at a premium of Rs.201.7. The breakeven of the call option will be 15601.7(15400+201.7). Since the lot size of Nifty is 50 the inflow is Rs.10,085. The spot price at the time of buying call was Rs.15413.30. Let us see what the pay-off looks like.
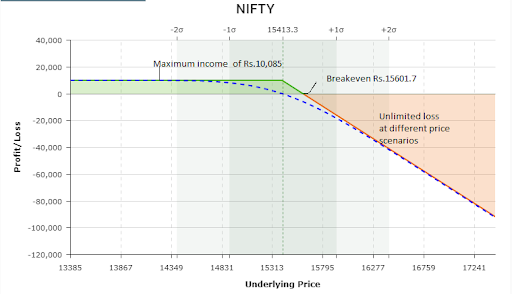
In a short call, the losses can be unlimited as you are earning a premium for somebody’s risk. The income or profit is limited to the premium earned. In the above pay-off, we can see that the orange shaded area that shows the profit scenarios at different price levels on expiration. The maximum profit area is the green shaded area which is the premium received. The dotted blue line is the pay-off for today.
Pay-off diagram for a long put
A long-put option means the market is expected to go down. Similar to a long call a cost is paid in the form of a premium. Therefore, the breakeven for a long put would be the strike price minus the premium paid. For example, a put option is bought with a strike price of 15400 at an Rs.190 premium. The breakeven of the put option will be 15200(15400-190). Since the lot size of Nifty is 50 the outflow is Rs.9500. The spot price at the time of buying put was Rs.15413.30. Let us see what the pay-off looks like.
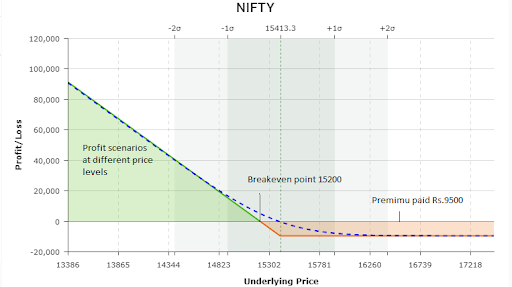
In the long put, the profit can be unlimited as markets can go to rock bottom also. The loss again here like a long call is limited to the premium paid. In the above pay-off, we can see that the green shaded area shows the profit scenarios at different price levels on expiration. The maximum loss area is the light orange shaded area which is the premium paid. The dotted blue line is the pay-off for today.
Pay-off diagram for a short put
A short Put means expecting the market to rise. Since you are selling or writing a call you are assuming somebody’s risk. He is paying a premium and you are collecting a premium i.e., the income you pocket. Therefore, the income would be limited and the risk would be higher. The breakeven will be the strike price minus the premium received. For example, a short call position is created at a strike price of 15400 at a premium of Rs.190 The breakeven of the call option will be 15210 (15400-190). Since the lot size of Nifty is 50 the inflow is Rs.9500. The spot price at the time of buying call was Rs.15413.30. Let us see what the pay-off looks like.
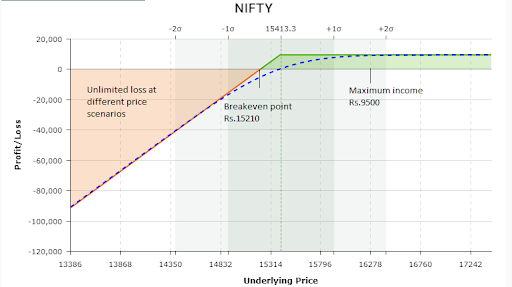
In the short put, the losses can be unlimited as you are only earning a premium for somebody’s risk. You become the underwriter of risk and the profit is limited to the premium received. In the above pay-off, we can see that the orange shaded area that shows the loss scenarios at different price levels on expiration. The maximum income area is the green shaded area which is also the premium received. The dotted blue line is the pay-off for today.
Frequently Asked Questions
What is a pay-off diagram?
A pay-off diagram is a visual representation of the profit and loss scenarios of an option position.
How can one read a pay-off diagram?
It is similar to any chart with an X-axis and a Y-axis. The X-axis represents the price of the security while the Y-axis represents the profit and loss.
How many types of pay-off diagrams are there?
There are 4 types of pay-off diagrams as mentioned below
- Long-call option
- Short-call option
- Long-put option
- Short-put option
What is the use of a pay-off diagram?
It is a useful tool to understand the profit scenarios of complex option strategies. Complex option strategies will have different pay-offs for each leg of an option. A pay-off diagram sums up all of them and constructs a diagram to track the profits and risks.


How Would You Rate This Chapter?
Next
Comments (0)