All About Quarterly Results

As per listing clause 41 of the Securities Exchange Board of India (SEBI), all the listed companies have to publish their quarterly financial results. It is a compulsory filing of a company’s performance report. The purpose of announcing quarterly results is to help the investor to assess the performance of the company regularly and take an informed decision on whether to continue to hold the investment. The results have to be published within 45 days from the end of each quarter.
Beginning of the earnings season
The earnings season begins in the following month of the respective quarters. It is one of the most keenly watched rituals by all the stakeholders and prospective investors.
The board of directors of a company informs the stock exchanges at least seven days before the Board meeting in which the unaudited financial results for the quarter is approved. Many investments advisory or broker websites have a quarterly results calendar that shows companies that are slated to declare their results on respective dates.
The quarterly results seasons begin with many of the brokerage houses analysts sending out previews (the result expectations/analyst estimates) based on their analysis and management guidance from the previous quarters. These previews contain the expected business performance based on the guidance, the prevalent industry scenario and the financial impact both positive and negative. One must note that not all companies give guidance and we have to rely on our assumptions and estimates.
The quarterly result cycle thus consists of the management guidance, preview, the actual earnings and deviations. The deviations can be either positive or negative based on which the decision can be made whether one can stay invested.
Contents of the statement of unaudited financial results
| Particulars | Remarks | |
| Income | Revenue from operations or sales and other income has to be disclosed | |
| Expenditure | 1. Cost of materials 2. Purchases 3. Change in inventory 4. Employee cost 5. Finance cost 6. Depreciation 7. other expenditure | |
| Profit | 1. Profit before exceptional items 2. Exceptional items 3. Profit before tax 4. Tax expenses 5. Profit for the period for continuing business (net profit) | |
| Other comprehensive income | These are below the line adjustments which includes revenues and expenses, gains and losses that have not been realised. They are excluded from the net income statement. These are notional items. | |
| Paid-up Equity capital & reserves | Paid-up equity capital and reserves to be shown | |
| Earnings per share (EPS) Basic and Diluted | Basic EPS and diluted EPS before and after extraordinary items is shown. These are non-annualised | |
| Notes | Notes to the statement that affects the results are also to be part of the quarterly results | |
| Period | All of the above are to be shown in the following manner 1. For the quarter 2. for the corresponding previous year quarter 3. for the previous quarter 4. Year to date results 5. Previous year ended | |
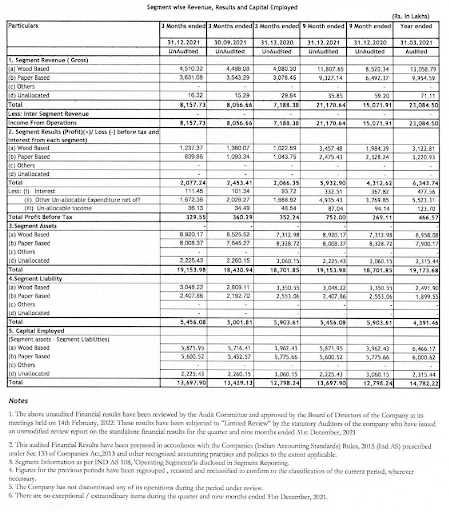
Contents of segment results
| Particulars | Remarks | |
| Segment revenue (gross) | Revenue from the main segments of the company has to be disclosed. | |
| Segment results Profit-loss before tax, interest (PBIT) | PBIT from each segment has to be shown | |
| Interest | Interest for each segment has to be disclosed | |
| Profit Before Tax | Profit before tax for each segment has to be disclosed separately | |
| Segment Asset | Segment asset, segment liability and capital employed for each segment has to be disclosed | |
| Segment liability | ||
| Capital employed | ||
| Period | All of the above are to be shown in the following manner 1. For the quarter 2. for the corresponding previous year quarter 3. for the previous quarter 4. Year to date results 5. Previous year ended | |
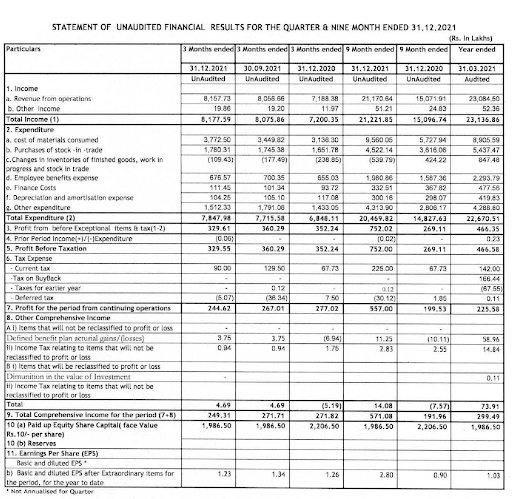
A published statement of financial results
How to understand the quarterly results
The standalone or consolidated quarterly financial results which are nothing but the income and expenditure statements in the prescribed format is the most important statement to be analysed. This statement contains the operational details in terms of revenues, profits, dividends declared and earnings per share for the quarter. A lot of questions need to be asked in this section.
-
- What has been the revenue growth? Has there been revenue growth? Is it better or worse? Has it beaten the street or analyst expectations? Is it in line with the management guidance?
-
- Operating expenses? is there any spike in expenses? the causes for the same and is it one time or recurring?
-
- How are the margins? Have the margins improved? Why have they improved or dropped? Is it in line with expectations and guidance?
-
- Interest costs? An increase in interest costs can be a sign of financial stress. However, an increase in interest accompanied by an increase in business is a good sign and shows the efficiency of the management.
-
- Has the operating profits and net profits improved or deteriorated? The reasons for the same? What were the management guidance and analyst expectations?
-
- Exceptional items need to be looked into as at times they can be a signal to exit the investment. Exceptional items are those that impact the profits quite drastically at times. The impact has to be examined in its proper light to decide to stay invested or not.
- Earnings Per Share (EPS) Check for growth in EPS. Growth in EPS is a healthy sign and reassures the investor to stay invested.
- Segment results also need to be analysed similarly. Asking questions on which segment has contributed to the growth of sales and profits? Have the margins for the segments changed? What has been the return on capital employed for each segment so that we can understand how efficiently the assets are used.
Apart from the comparison of the quarterly numbers viz-a-viz its previous quarters (q-o-q) and corresponding previous year quarter (y-o-y) for performance, one has to understand the qualitative aspects as well. Has the revenue improved because of an increase in volumes or increase in prices, has the profits increased because of cost control and efficiencies? The qualitative aspect cannot be ignored. Be sure to ask the question about the quality of earnings.
Earnings call
Many listed companies hold a post result earnings conference call over a telephone or a webinar to deliberate the results for the quarter. Investors, analysts and other stakeholders attend the call where the management elaborate on the just-released results and guidance for future performance. Earnings calls are a key source of information from the management of the company and therefore helps the analysts and investors alike to incorporate these in their fundamental analysis model. Thus, it helps in the decision of being invested in the company or exit and plan a better entry.
The earnings call begins with a disclaimer from the management as the earnings call contain futuristic statements subject to change in the variables. The presentation includes a detailed discussion of the results and plans of the company and source of funding and the resultant future earnings. The management that presents usually consists of the chief executive officer, chief financial officer and other business heads. The presentation is followed by a question-and-answer session that helps in clarifying many doubts. The earning call is available on the website of the company and the exchange filings for future reference.
Driving home with an example
| Item | Growth period | Remarks | Conclusions | |
| Revenue | Y-o-Y | Revenue for the quarter December 21 at Rs.81.58 crore has grown by 13.5% from Rs.71.88 crore of December 20 quarter. | The revenue for the company has been increasing steadily as can be seen by the YTD growth of over 40%. This may be largely due to improvement in both volumes and margin. | |
| Q-o-Q | Revenue for the quarter December 21 at Rs.81.58 crore has grown by 1.25% from Rs.80.57 crore of September 21 quarter. | |||
| YTD | The revenue for the nine months ended has shown exceptional growth. The revenue at Rs.212.22 crore for Nine months ended December 2022, has grown by 40.57 % from Rs.150.97 crore of none months ended December 2021. | |||
| Expenses | Y-o-Y | The overall expenses grew by 15 %. The main contributors to this increase in cost have been the material cost which grew by 20 %, interest cost grew by 18%. Employee cost and other expenditure also grew by 3% and 5.5% respectively. | Expenses have increased mainly due to an increase in raw material costs and other expenses. This may be due to improved market conditions due to covid. | |
| Q-o-Q | The overall expenses grew by 2 %. The main contributors to this have been raw material cost which grew by 20%, followed by employee cost and interest cost at 3% and 10 % respectively. Other expenses have seen a fall of 15.5%. | |||
| YTD | The overall expenses grew by 38 %. The raw material cost has increased by 67% and employee cost has increased by 25%. While the interest cost has come down by 10% the other costs have increased by 54%. | |||
| Operating margins | Y-o-Y | The operating profit margin for the quarter was at 6.44% as compared to 7.67% corresponding to last year’s quarter. | Operating margins have improved due to an increase in selling prices as the company has to absorb the increase in expenses. | |
| Q-o-Q | The q-o-q margins were at 6.79%. The operating margins have dropped both in Y-o-Y and Q-o-Q due to higher expenses. | |||
| YTD | The nine monthly operating margins improved marginally to 6.3% compared to the corresponding previous period of 6.03% | |||
| Profit before tax (PBT) | Y-o-Y | PBT growth has dropped by 6.25% during the quarter as compared to the previous year quarter from Rs.3.53 crore to Rs3.3 crore | The nine months profits have crossed the previous year’s March ended 2021 profits. While the PBT has surpassed the march ended profit by almost 60%, the PAT has more than doubled in the none months. | |
| Q-o-Q | PBT growth has dropped Q-o-Q also by 8.33% from Rs.3.6 crore to Rs.3.3 crore | |||
| YTD | However, the nine monthly PBT of Rs.7.52 crore has surpassed the full-year March-21 PBT of Rs.4.66 crore. | |||
| Profit after tax (PAT) | Y-o-Y | PAT has declined by almost 12% as compared to the previous year quarter | ||
| Q-o-Q | PAT has seen a decline Q-o-Q by 8% | |||
| YTD | However, the nine months PAT of Rs.5.57 crore has surpassed the full-year March-21 PAT of Rs.2.26 crore. | |||
Frequently Asked Questions (FAQs)
What is a quarterly report?
The quarterly report is a set of statements like profit & loss account, balance sheet and cash flow statements issued by a company every quarter about the performance of the company in the quarter.
What is the purpose of releasing a quarterly report?
The purpose of announcing quarterly results is to help the investor to assess the performance of the company regularly and take an informed decision on whether to continue to hold the investment.
What is the difference between a quarterly report and an annual report?
The annual report details the financial performance of the company over 12 months while the quarterly results do the same thing for 3 months.
What is included in a quarterly report?
A quarterly report contains key accounting data and financial data like gross revenue, net revenue, operating profit, net profit earnings per share etc., It is also accompanied by a company presentation with key performance indicators that are presented to the investors, analysts and other stakeholders.
What are the key points that need to be seen in a quarterly report?
The key points one needs to see are the following
Growth in revenue, growth in profits both at the operating level and net level, improvements in the margin, interest cost, exceptional items, growth in earnings per share. One needs to compare these with the previous quarter and corresponding previous year too. Also, one needs to understand the qualitative aspects of the above-mentioned indicators.


How Would You Rate This Chapter?
Next
Comments (0)