What Are Long Wick Candles? All You Need to Know
Feb 11 2022 6 Min Read
In recent years, there has been a significant surge in the number of retail traders. While some traders still depend on fundamental analysis for evaluating investment opportunities, there has been a discernible shift towards the adoption of technical analysis. This methodology entails examining historical price and volume data to predict future price movements, gaining traction, especially among traders concentrating on shorter time frames. Long wick candles have emerged as a key focal point for traders seeking to identify potential price reversals and market sentiment shifts.
What Is a Candlestick?
One of the most prominent techniques in technical analysis is candlestick pattern analysis. While candlestick analysis has always been a vital aspect of technical analysis, it traditionally focused on the body of the candle. However, the wicks or shadows play a crucial role in candlestick patterns, as they indicate significant changes in price levels, representing the high and low of a specific trading session. Wick trading thus revolves around price levels formed outside of the day’s open and close prices, with the length of the wick being essential for determining trading strategies.
A short wick indicates that trading mostly occurred between the open and close prices of the period, whereas a long wick suggests that price movements surpassed or breached the open and close price limits. It’s important to distinguish between a long upper wick and a long lower wick. A long upper wick candlestick occurs when the candle’s high is strong but the closing price is weak, indicating that although buyers attempted to dominate most of the session, sellers ultimately drove the price down. Conversely, a longer lower wick suggests that the trading session ended strongly, with sellers dominating initially but buyers managing to push prices up.
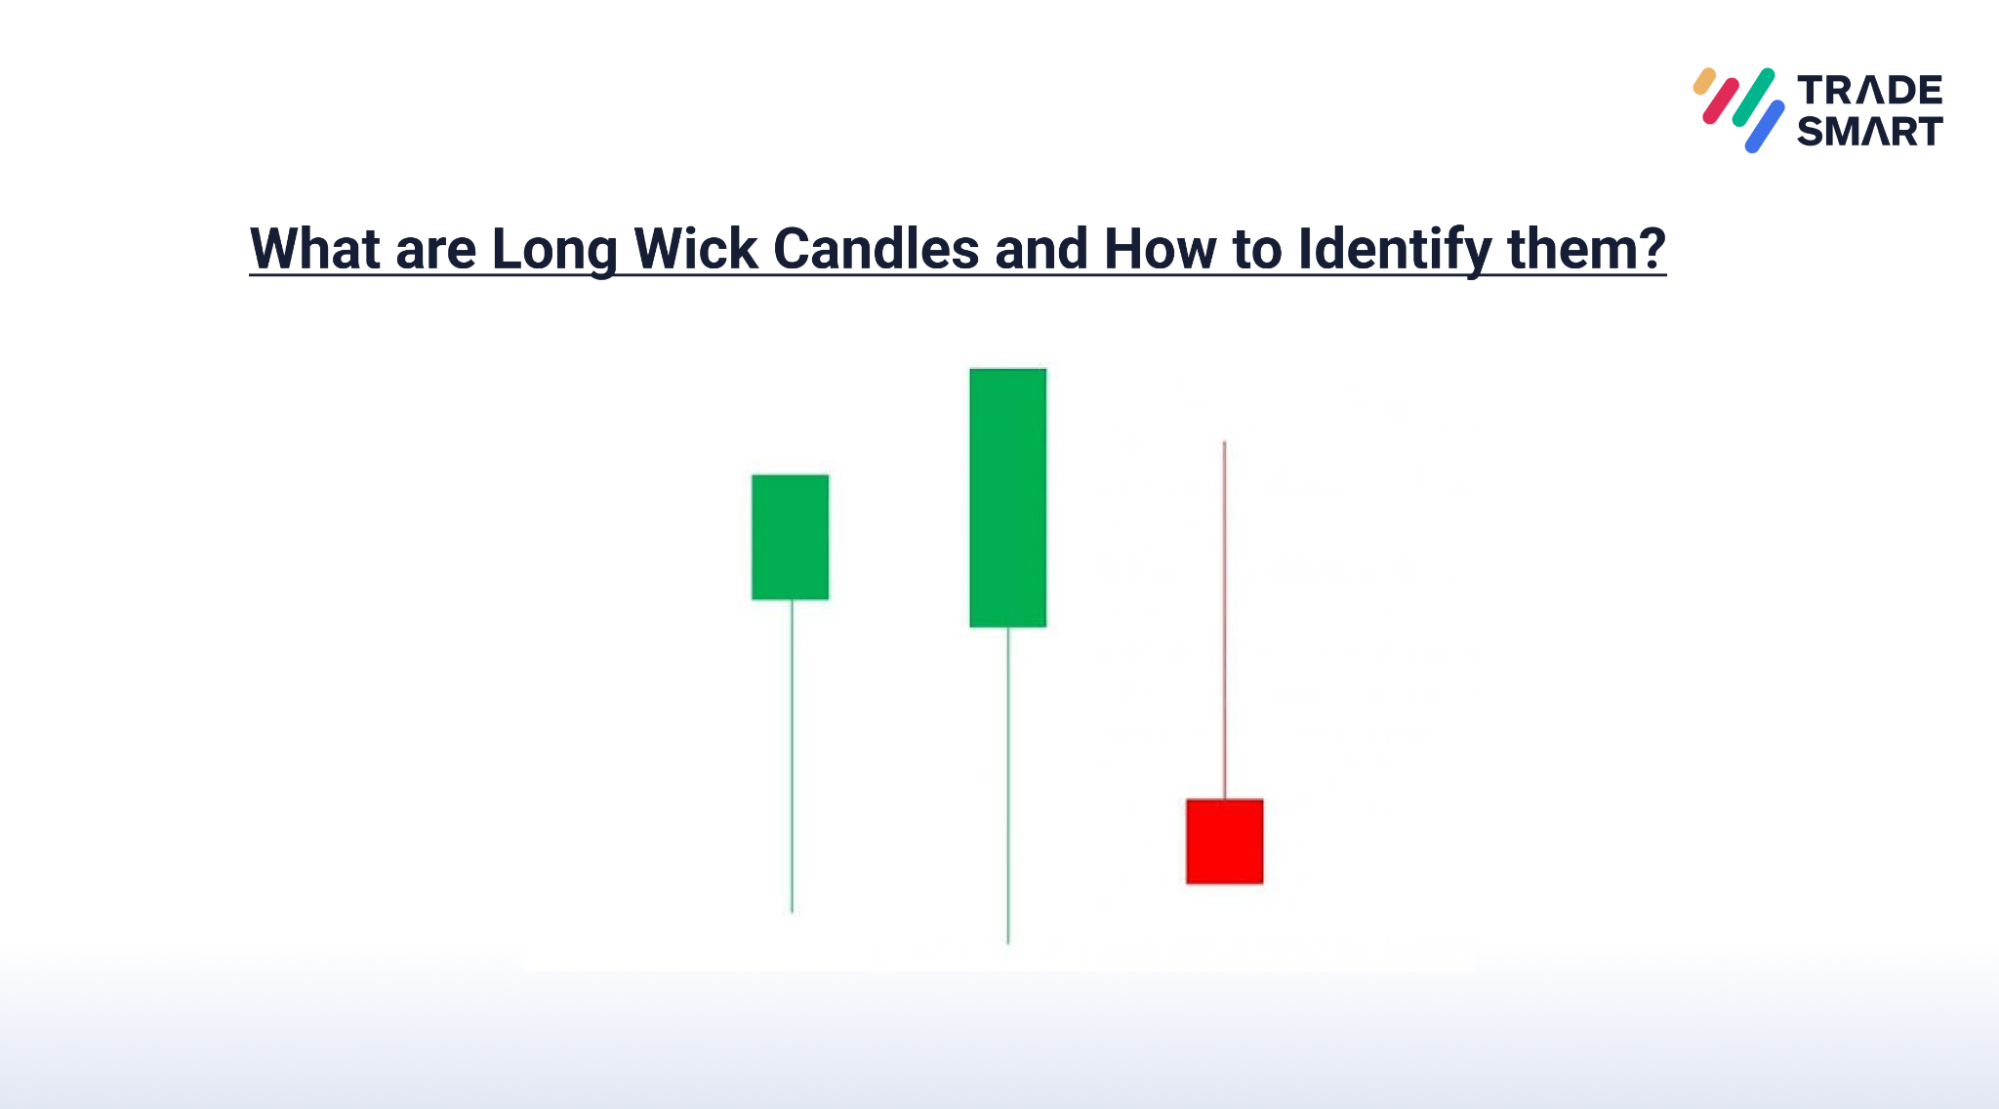
What are Long Wick Candles and How to Identify them?
Trading with long wick candlesticks occurs when prices undergo testing but are ultimately rejected. These wicks signify levels of rejection. Prior to observing a long lower wick, there’s typically a long bearish candle where bears dominate, followed by bulls exerting pressure to reverse the trend upward. As prices start to rise, a pronounced lower shadow or tail emerges, transforming the prior bearish candle into one with a long tail. Conversely, a long upper wick candlestick begins with a bullish candle, but as bears take control, prices decline, revealing a prominent upper wick or shadow.
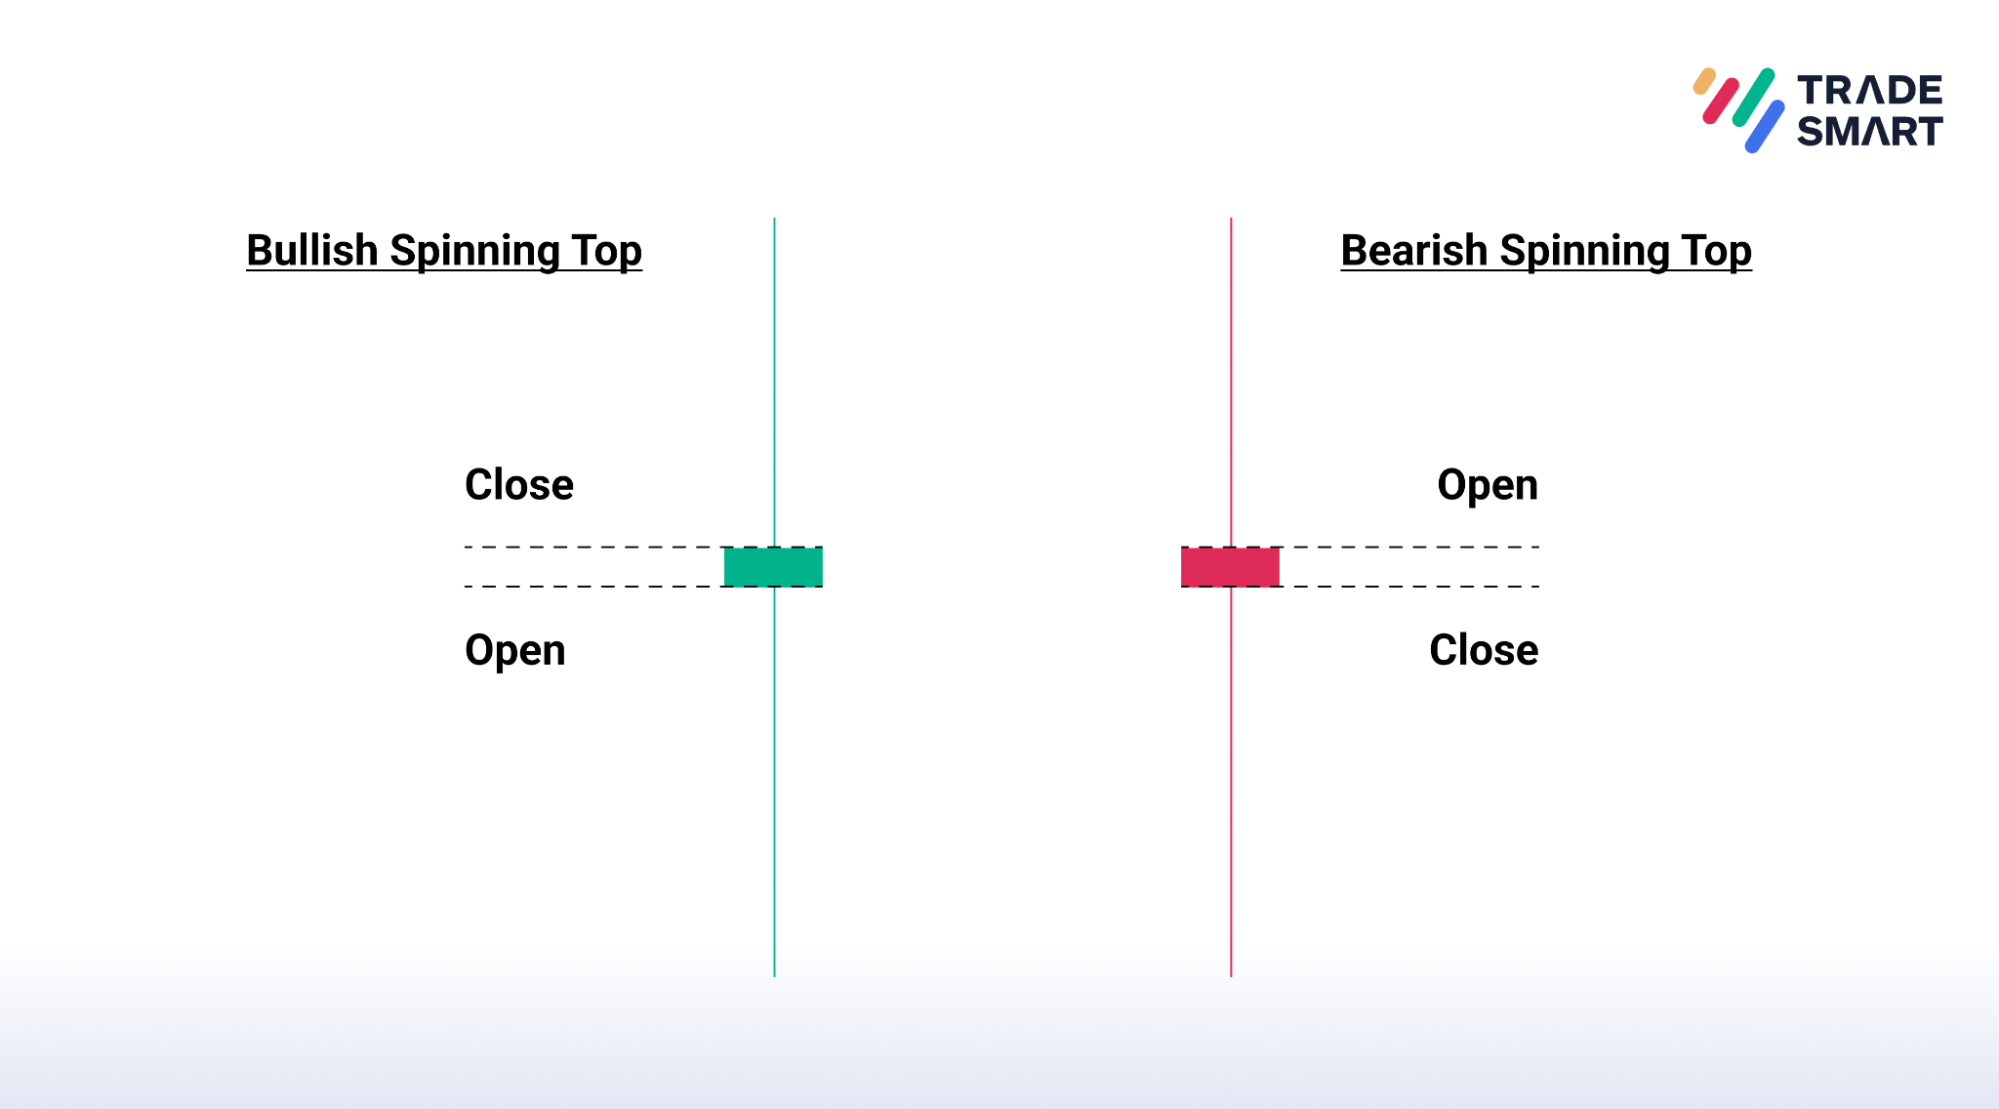
Typically, the upper and lower wicks of candlesticks aren’t of equal length. However, there are occasions when neither wick surpasses the other. In such instances, the candlestick exhibits a long upper wick and an extended tail, yet the body is small. This formation is referred to as a spinning top, indicating a potential stalemate between bulls and bears, both of whom have been actively trading.
At times, candlesticks may lack any wick or tail altogether. Such candlesticks are known as Marubozu Candlesticks. A red Marubozu occurs when the opening price equals the high, and the closing price equals the day’s low, indicating a bearish sentiment. Conversely, a green Marubozu represents a bullish sentiment, where the opening price equals the low and the closing price equals the day’s high.
These conditions highlight the versatility of wick trading, encompassing not only long or short wicks and tails but also instances with no wicks or equal long wicks and tails. Wick trading holds significant importance as wicks provide insights into supply-demand dynamics, market sentiment, and factors influencing price changes.
Identifying long wick candles involves several key steps:
- Long wick candles are easily recognizable by their extended candle wicks.
- Look for candles with long wicks that are notably longer than others on the same day.
- Identify price levels likely to align with the long wicks, indicating potential support and resistance levels.
Utilize these identified levels in conjunction with the long wicks to assess trade opportunities effectively.
Types of Long Wick Candles
There are two types of long wick candlesticks:
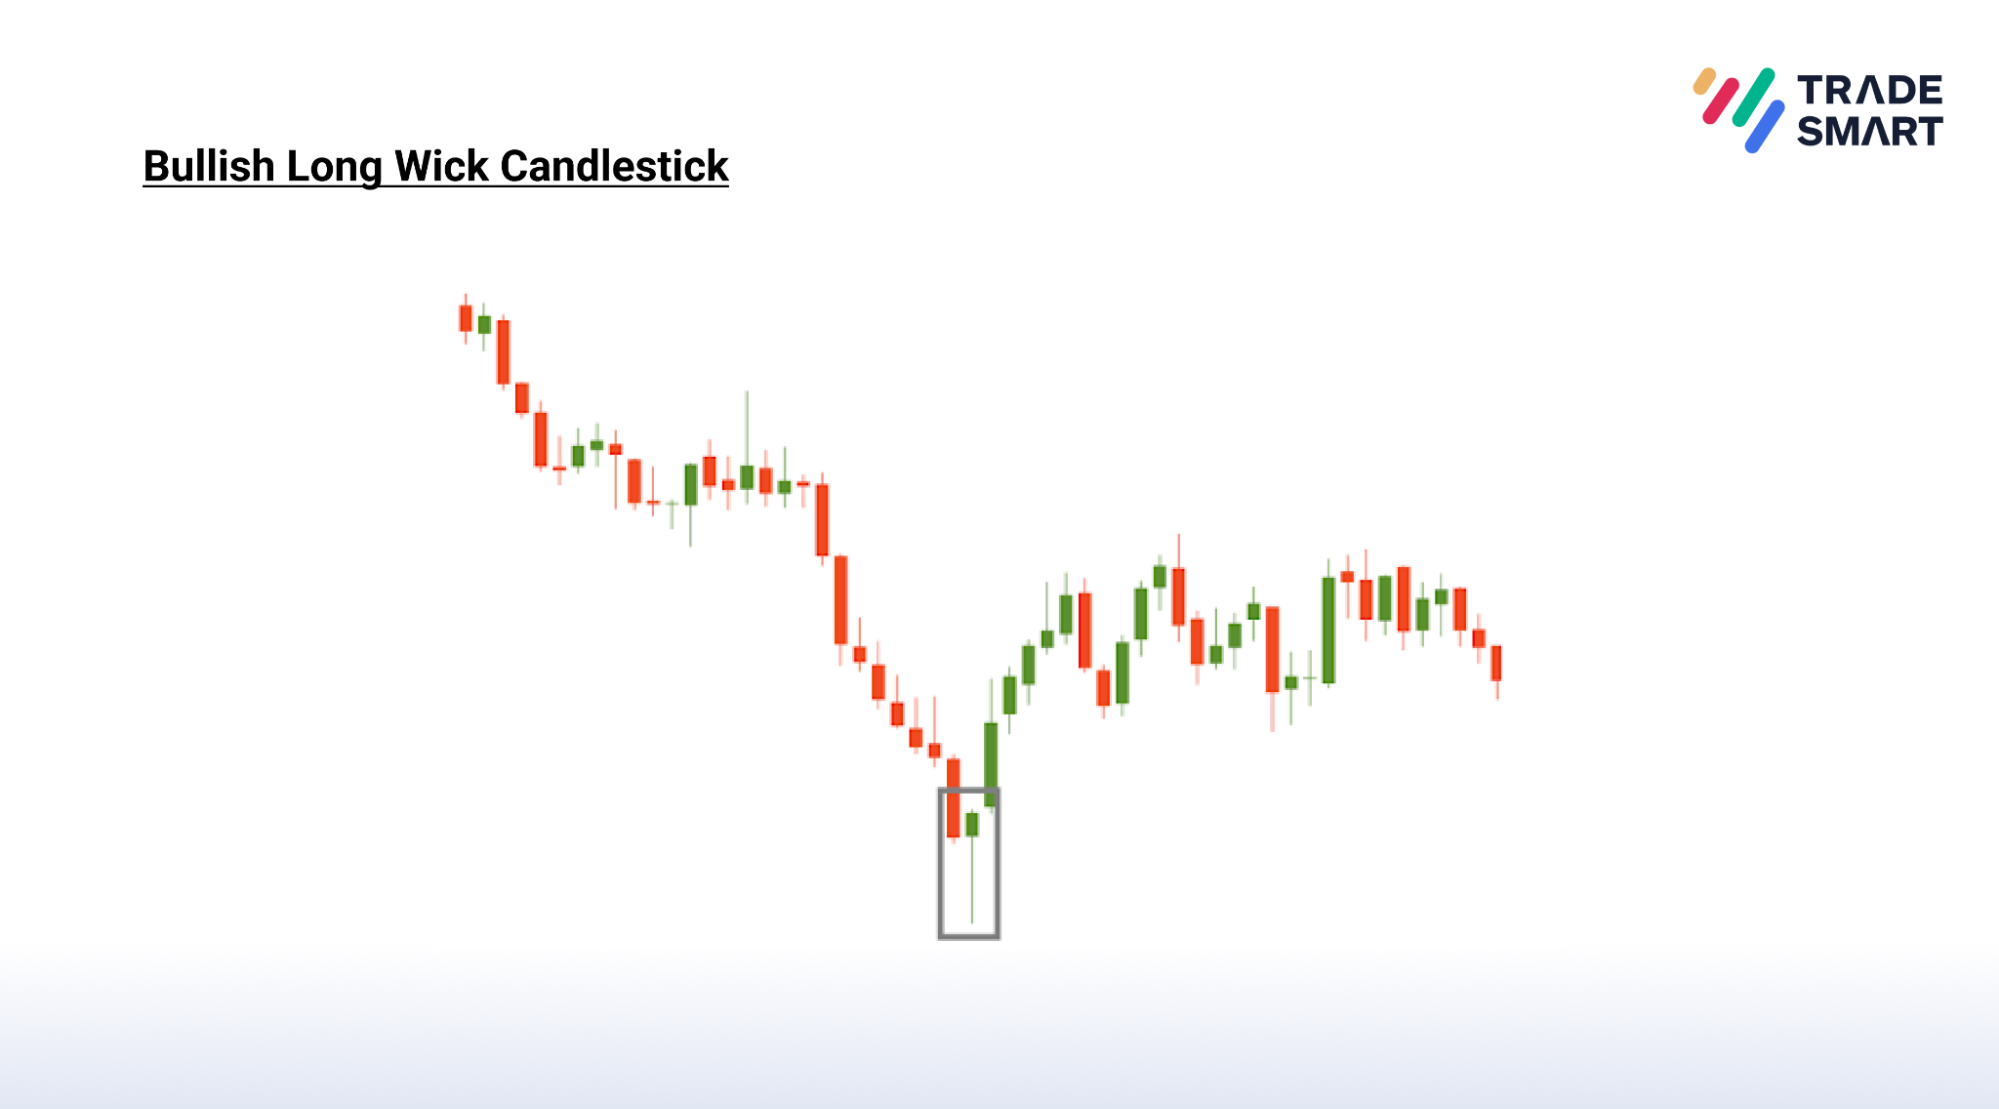
1. Bullish Long Wick Candlestick
This candlestick pattern features a long tail below the body of the candle, typically observed after a prolonged downward trend. Its appearance often signals a potential bullish reversal, indicating a shift towards an upward price movement. This suggests that the security may be reaching a bottom after experiencing a significant decline, with a potential for price appreciation ahead. The extended tail below the body symbolizes efforts by sellers to drive the price down substantially, only to be countered by buyers who demonstrate notable buying strength, resulting in a price rebound.
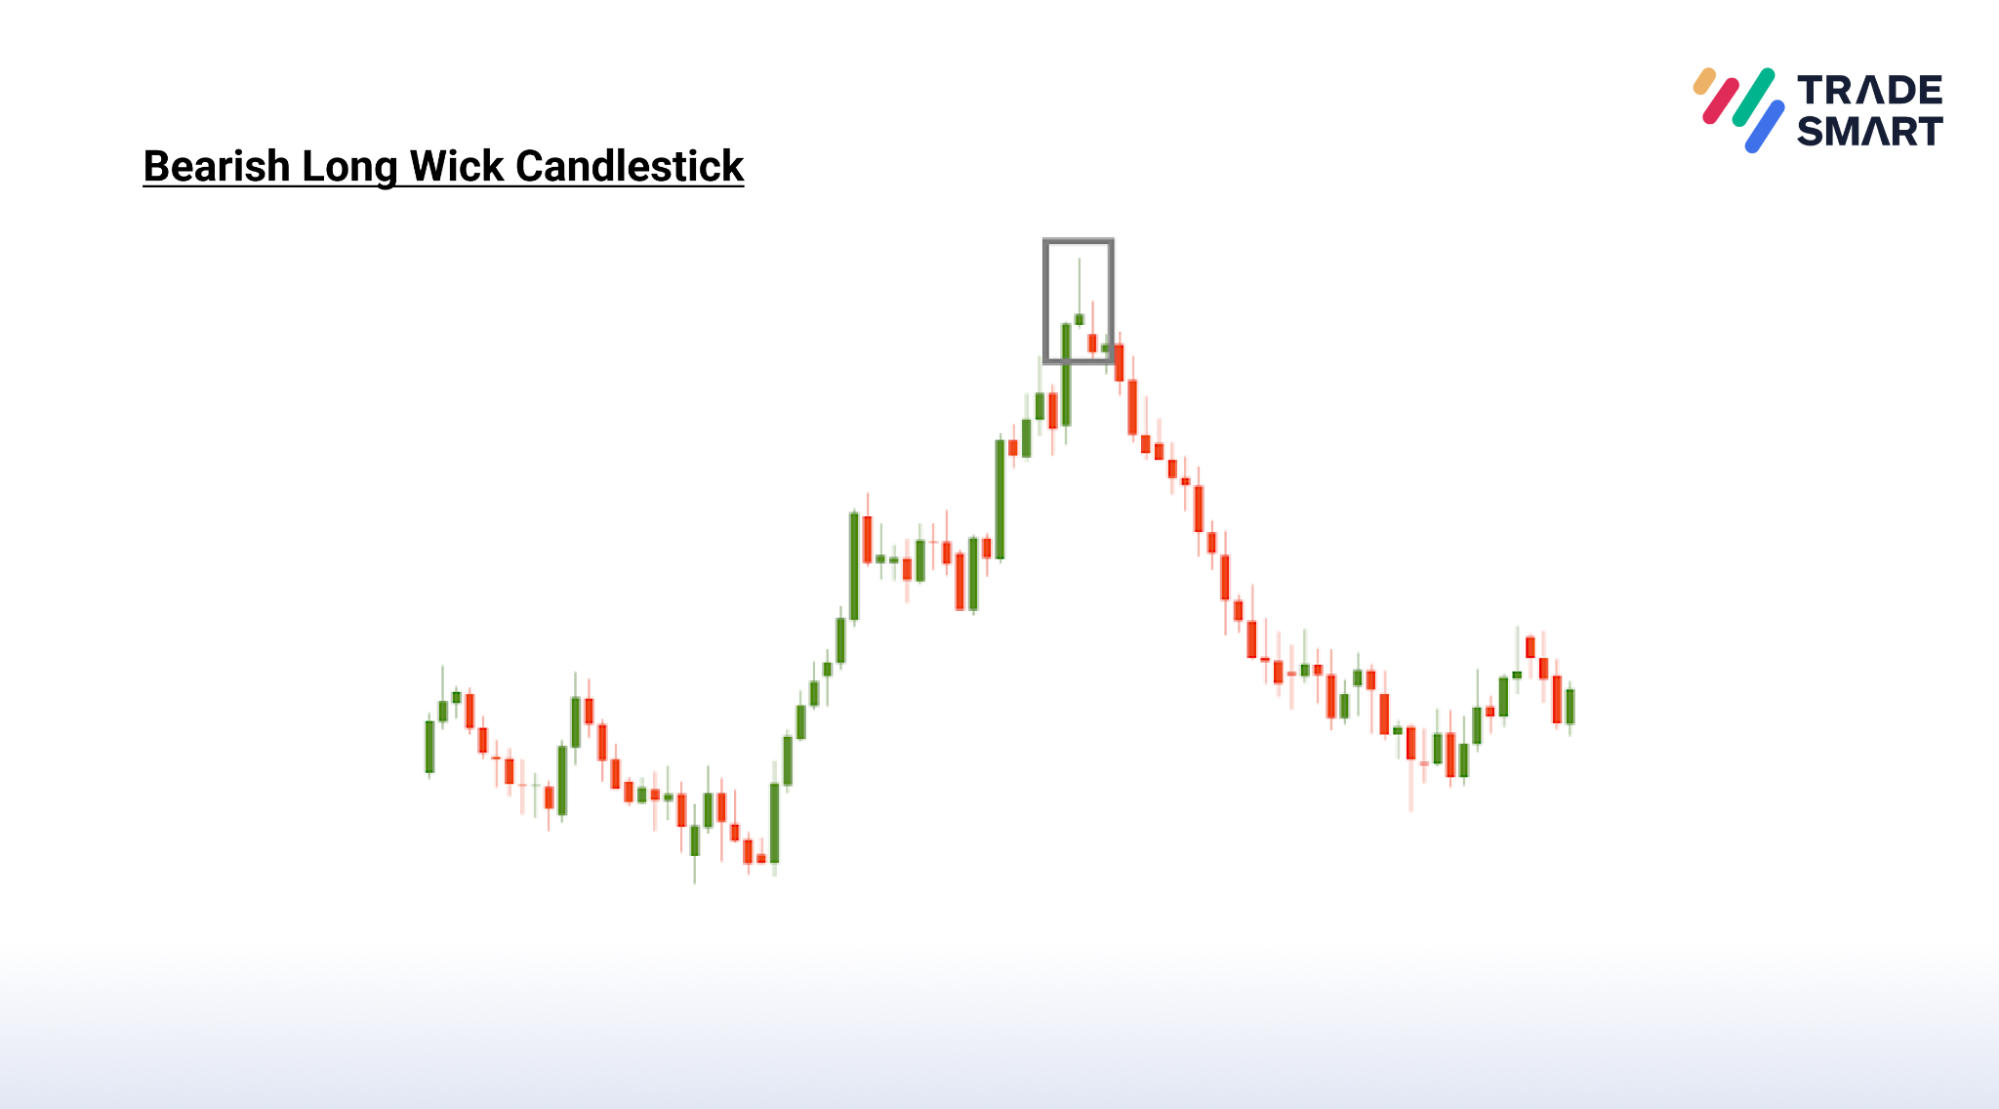
2. Bearish Long Wick Candlestick
In this candlestick pattern, a long wick appears above the body of the candle, typically occurring after a period of uptrend characterized by a significant price increase. The presence of this long wick can indicate a bearish reversal signal, suggesting that the security may be reaching a peak and could potentially experience a sudden decline in price. The extended wick above the candle’s body signifies that buyers’ attempts to dominate over sellers have been unsuccessful. As a result, sellers are likely to gain momentum and successfully drive the price downwards, leading to a decrease in price.
Significance of Long Wick Candles
Long wick candles are significant because they often signal important price rejection or reversal points in the market. When a long wick forms, it signifies significant price movement in one direction during the trading period, followed by a reversal back in the opposite direction, often erasing most or all of the gains or losses incurred.
For instance, let’s consider a long upper wick candle in an uptrend. This candle indicates that buyers initially drove the price higher, but by the period’s end, strong selling pressure pushed it back down, closing near or below the opening price. This suggests a potential loss of momentum in the uptrend, potentially signalling a reversal to a downtrend.
Similarly, a long lower wick candle in a downtrend suggests that sellers initially pushed the price lower, but by the period’s end, strong buying activity pushed it back up, closing near or above the opening price. This implies a potential loss of momentum in the downtrend, potentially signalling a reversal to an uptrend.
In both scenarios, long wick candles reflect significant indecision or a battle between buyers and sellers at that price level. This serves as a signal for traders to take notice, as it could indicate a potential change in trend direction or the continuation of the current trend, depending on various factors and market context.
Trading Strategies using a Long Wick Candle
1. Reversal Trading Strategy
Traders often use long wick candles as a signal for potential reversals in price direction. For example, after a prolonged downtrend, a long lower wick candle can indicate that sellers tried to push the price lower but were unsuccessful, and buyers stepped in, potentially signalling a reversal to an uptrend. This is because the long lower wick shows that there was significant buying interest at lower price levels, which could lead to a reversal in the direction of the trend.
Traders using this strategy may enter a trade in the direction opposite to the previous trend once they see a long wick candle forming, with a stop-loss order placed below the low of the candle for risk management.
2. Confirmation Trading Strategy
While long wick candles can be useful for identifying potential reversals, traders often look for confirmation from other indicators or candlestick patterns before making a trading decision based solely on the long wick candle. This is because long wick candles, while indicative of price rejection, can sometimes be false signals.
For example, traders may look for confirmation from other technical indicators such as moving averages, RSI (Relative Strength Index), or MACD (Moving Average Convergence Divergence). They may also look for additional candlestick patterns, such as bullish or bearish engulfing patterns, to confirm the potential reversal indicated by the long wick candle.
By waiting for confirmation, traders can reduce the risk of entering trades based on false signals and increase the likelihood of entering trades with favourable risk-reward ratios.
Caution in Using Long Wick Candles for Trading
While long wick candles can provide valuable insights into potential price reversals or rejection levels, it’s important for traders to exercise caution and not rely solely on them for making trading decisions. Here are some key considerations:
1. Market Conditions
Long wick candles should be interpreted in the context of the overall market conditions. For example, during periods of high volatility, long wick candles may be more common and may not necessarily indicate a significant reversal in price direction. Traders should consider the broader market environment before making trading decisions based on long wick candles.
2. Trend Analysis
It’s important to consider the prevailing trend when interpreting long wick candles. A long wick candle may have different implications depending on whether it occurs in an uptrend, downtrend, or in a ranging market. Traders should use trend analysis tools, such as trend lines or moving averages, to confirm the direction of the trend before acting on signals from long wick candles.
3. Volume
Volume is an important factor to consider when analyzing long wick candles. A long wick candle accompanied by high trading volume is typically more significant than one with low volume. High volume indicates strong participation from traders and can confirm the validity of the signal provided by the long wick candle.
4. Confirmation from Other Indicators
As mentioned earlier, traders should seek confirmation from other technical indicators or candlestick patterns before making trading decisions based solely on long wick candles. This helps reduce the risk of entering trades based on false signals and increases the likelihood of entering trades with favourable risk-reward ratios.
5. Risk Management
Regardless of the signals provided by long wick candles or other technical indicators, traders should always prioritize risk management. This includes setting stop-loss orders to limit potential losses and managing position sizes to avoid overexposure to any single trade.
Conclusion
Long wick candles serve as potent tools in technical analysis, signalling robust price rejection or potential market reversals. They offer valuable glimpses into price action, revealing instances where attempted price movements were staunchly rejected, leading to a reversal in the opposite direction. Although these candles can aid in pinpointing potential entry or exit points in trading strategies, it’s imperative for traders to supplement their analysis with other technical indicators and factor in prevailing market conditions for confirmation. Relying solely on long wick candles for trading decisions is ill-advised; instead, traders should adhere to sound risk management practices to mitigate potential losses.
Frequently Asked Questions
A long upper wick occurs when the high is strong, but the closing price is weak. A lengthy tail on the candle suggests a trading session that concluded with strength, despite initial dominance by sellers, as buyers successfully pushed prices higher.
The wick, also known as the shadow, represents the intra-day high and low points. The color of the body reflects the direction of market movement; a green (or white) body signifies a price increase, whereas a red (or black) body denotes a price decrease.
A shadow, or a wick, is a line extending from the body of a candle on a candlestick chart, indicating the price fluctuations of a stock in relation to its opening and closing prices. These shadows delineate the highest and lowest prices at which a security is traded during a specific time period.
A shadow, or wick, is a small line at the top or bottom of each candle that shows the day's highs and lows. A candlestick with no shadow, also known as a Marubozo Candle, means the price at the open and close are equal to the high and low prices during the session. In other words, the price has not broken through its open and close levels.
Long wicks indicate that the price moved significantly during the trading period but ultimately closed near the opening price. A long upper wick suggests that sellers pushed the price down from the high, while a long lower wick suggests that buyers pushed the price up from the low.

