Introduction
Intraday trading is a way to trade in stocks where the trader buys and sells shares on the same day without any open positions left at the end of the day. Thus, intraday traders try to buy the stock at a lower price, sell it at a target price.
In stock markets, the price fluctuates every second. A trader must know when to buy and sell the stocks to earn positive returns. Tools like candlestick charts are of great help to traders. However, such requires a good understanding of the charts and relevant information that can help them make the right decisions.
So, we will talk about the fundamentals of Candlestick’s meaning and understand the steps to help you read them.
What is Technical Analysis?
Technical analysis is a technique of forecasting the future financial price movements of the stock based on an examination made of the past price movements of the stock price.
Technical analysis is not a technique of seeing the future but it helps an investor to forecast what is “Likely” to happen to the price of a share of a company. It uses the information captured by the price to interpret what the market is saying with the purpose of forming a view of the future.
What is Candlestick Chart?
Candlestick Chart originated in Japan over 100 years before the bar charts and point-and-figure charts. A Japanese man named Homma discovered that the price of rice was highly influenced by the emotions of the people along with the supply and demand of rice.
A candlestick chart shows that emotion by picturising the size of the price moves using different colours. By regularly analysing the candlestick chart, an investor can make a trading decision based on the regular occurring patterns of directions of the price.
Unlike a simple line chart, each series on a candlestick contains four data points. i.e., The opening price, The high price, the Low price, and the closing price.
Components of a candlestick chart
The components of a candlestick chart are as follows:
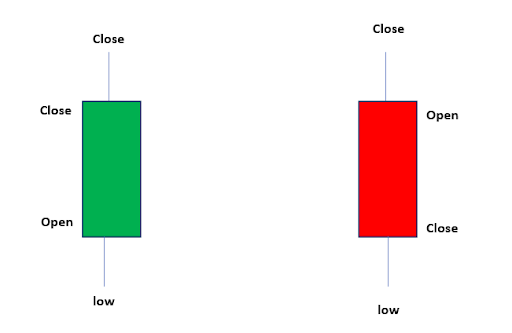
The body
The main body of a candle stick (The portion which is coloured) shows investors the closing and opening price of the share.
If the body of a candlestick is long, it indicates that the share has been traded more often in the market, and there is strong selling or buying pressure created for the share in the market.
When the body of a candlestick is small, it indicates that the share has been traded less in the market, and there is light selling or buying pressure for the share in the market.
The Wicks
The highest top of the highest wick shows an investor the highest price at which the stock was traded for the period for which the candlestick is prepared.
If the open or close was the lowest, then there would be no lower wick. While the lowest bottom of the lowest wick shows an investor the lowest price at which the stock was traded for the period for which the candlestick was prepared.
If the open or close were the lowest, then there would be no lower wick.
The Colour
Traditionally, the candlesticks were of two colours, i.e., white and black, which are now sometimes replaced with green and red, respectively.
The green colour or the white colour indicates that the stock price has closed higher than the open price of the stock, and the red colour or the black colour indicates that the price has closed lower than the open price of the stock.
Example of a candlestick chart.
As we can see, there is a red and green candlestick, and both of them represent different things.
When a candle stick is green, it means that the closing price was higher than the opening price, and when a candlestick is red, it means that the closing price was lower than the opening price.
Types of Candlestick Patterns
A candle has four price components; The open, The close, The high, and the low.
The combination of these four prizes forms different shapes known as candle or candle patterns.
Candle patterns can be single, double, or triple, depending on the number of candles it consists of. Following are the types of candle patterns:
Single Candle Pattern
A single candle pattern contains only a single candle.
(Examples; Hammers, Doji, spinning top, spinning bottom)
Double Candle pattern
Double candle pattern has two candles.
(Examples; Bullish engulfing, Bearish engulfing, Bearish Harami, Bullish Harami)
Triple Candle Pattern
Triple Candle Pattern has three candles.
(Examples; Morning star, Evening star, 3 white soldiers, 3 black crows)
Common Candlestick Patterns
The attitude of the market participants is reflected by a candlestick. Different types of candlestick patterns represent different types of market participants’ attitudes. The candlestick patterns can also reflect the trading patterns since investors are humans only and humans try to act similarly in the same situations.
The following are some common candlestick patterns:
Doji Candlestick pattern:
Doji candlestick pattern represents a situation where the stock price closes exactly where it opened. The Doji is a single candle pattern meaning it has a single candle because it shows a neutral situation where the market is neither bullish nor bearish. It is the only pattern that shows such a neutral situation. It looks like a dash only and has no body.
Example of a Doji Candlestick pattern
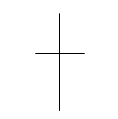
The price closes exactly where it opens because the Bullish and Bearish pressure in the market is at equilibrium.
The Bullish and Bearish pressures are roughly equal, which may cause a previous trend to end.
Such a situation may result in a market reversal, which means the price move is the opposite of the trend in previous periods.
Thus, a Doji Candle may indicate a price reversal in the coming future.
Hammer candlestick Family
This family consists of related single candlestick patterns. Hammer candlestick patterns have a long lower or upper wick and a small body on the opposite side.
The hammer candlestick pattern indicates a price reversal, just like the Doji Candlestick pattern. The following are the members of the hammer candlestick family:
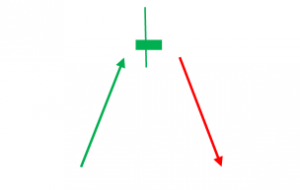
Hammer Pattern
A hammer candlestick chart will have a small body in the upper part of the candle and a long lower candlewick.
Bearish trends are shown by the hammer candlestick pattern and suggest that the price of the stock may go down.
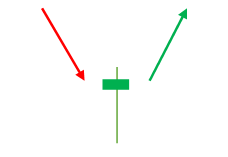
(The green arrow shows that the price moves higher while the red arrow shows the price decline).
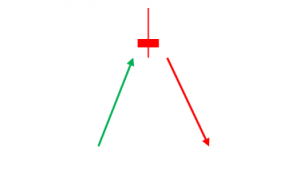
Inverted Hammer Pattern
An inverted hammer candlestick chart will have a small body in the lower part of the candle and a long upper candlewick. Bearish trends are shown by the inverted Hammer Candlestick pattern just like the hammer candlestick pattern and suggest price reversal.
(The green arrow shows that the price moves higher while the red arrow shows the price decline).
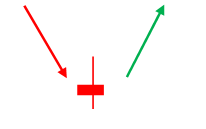
Hanging man Pattern
The hanging man pattern looks the same as the Hammer pattern, but bullish trends are shown by the Hanging man pattern. The hanging man pattern also shows that there might be a materialisation of the downside.
(The green arrow shows that the price moves higher while the red arrow shows the price decline).
Shooting star Pattern
The shooting star pattern looks the same as the inverted hammer pattern, but bullish trends are shown by the shooting star pattern. The shooting star pattern indicates that the recent rise could stop, and the market will start correcting lower.
(The green arrow shows that the price moves higher while the red arrow shows the price decline).
Engulfing Candlestick Pattern
Engulfing candlestick consists of a random candle and another bigger candle that fully encompasses or “Engulfs” the price action contained within the first thus, it’s a double pattern candle.
The Engulfing candlestick pattern that appears in a bullish market is called a Bullish Engulfing candlestick pattern, and the engulfing candlestick pattern that appears in a bearish market is called a Bearish Engulfing candlestick pattern:
Bullish Engulfing pattern
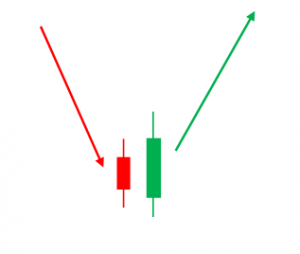
(The green arrow shows that the price moves higher while the red arrow shows the price decline).
Bearish Engulfing Pattern
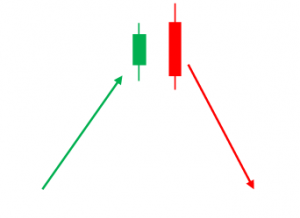
(The green arrow shows that the price moves higher while the red arrow shows the price decline).
Morning and Evening Star Candlestick Patterns
These are triple candle patterns, and they forecast market reversals.
Morning Star Pattern
The morning star pattern indicates an upward reversal and occurs during a bearish trend. It starts with a bearish trend and goes to a small bearish or bullish trend that gaps down.
Then the price goes up and forms a bigger bullish candle. The third candle should cover at least half the body size of the first candle.
Evening Star pattern
The evening star pattern is opposite of the morning star pattern and indicates a downward reversal and occurs during a bullish trend.
It starts with a bullish trend and goes to a small bullish or bearish trend that gaps down. Then the price goes up and forms a bigger bullish candle.
The third candle should cover at least half the body size of the first candle.
What are the pros and cons of executing analysis through candlestick charts?
There are several merits and demerits of making decisions based on candlestick chart analysis. Hence, we have listed the pros and cons of candlestick charts to facilitate a view of both sides of the coin.
Pros of candlestick charts
The merits of candlestick charts are as follows:
- Candlestick charts give a complete view of the four price levels in the chart, i.e. the open, the close, the high, and the low.
- Candlestick charts are the pictorial presentation of investors’ attitudes thus, making it easier to spot the market supply and demand.
- Candlestick charts help the investors to judge the future short-term direction of price.
- Candlestick charts consider the investors’ psychology and attitude in the determination of price direction.
Cons of candlestick charts
The demerits of candlestick charts are as follows:
- Understanding and analysing the candlestick charts may become complicated for the investor as it requires an investor to memorise the rules and types of patterns.
- A beginner investor may find a candlestick chart overload of information and data.
How to read a candlestick chart? – Price trends
Candlestick charts have been used by investors for more than 100 years till now; this is because candlestick charts cover a wide range of information relating to the stock prices and have design patterns that make them easy to read and understand.
In the candlestick chart, each candlestick indicates the open, the close, the high, and the low for the time frame a trader has chosen. Candlestick charts also show the current prices as they are prepared.
Following are the prices one needs to understand while reading a candlestick chart:
Open Price
The open price of a stock can be indicated by the top or bottom of the candlestick body, depending on whether the stock has moved up or down during the period.
If the price is trending up and closing higher than its open, then the open is indicated by the bottom of the body, and the close is indicated by the top of the body of a candlestick chart.
If the price is trending down and closing lower than its open, then the open is indicated by the top of the body, and the close is indicated by the bottom of the body of a candlestick chart.
The candlesticks that close higher are often filled in as either a green or a white-coloured candle. The candlesticks that close lower are often filled in as either a red or a black-coloured candle.
High price
The top of the shadow or the tail indicates the high price. If the open or close was the highest price, then there would be no upper shadow.
Low Price
The bottom of the shadow or the tail indicates the low price. If the open or close was the lowest price, then there would be no lower shadow.
Close price
The close price is the last price traded during the candlestick period, indicated by either bottom (for red or black candlestick) or top (for green or white candlestick) of the body of a candlestick chart.
Changes in the price of a stock change the candle patterns while it is forming; the open remains constant, but until the end of the candle, the high and low keeps on changing.
The colour may also change as the candle is forming; it may go from green to red if the price drops from a higher level than the open to a lower level than the open.
The last price of a stock when the period of candlestick ends is the close price, the candle gets completed, and a new candle starts to form.
Price Direction
A trader can know the direction of price by the colour and positioning of the candle(s) in the candlestick chart. In case the price closes lower than the open, the candlestick will be red, and the candle will be located below and to the right of the previous one.
When the price closes higher than the open, the candlestick will be green, and the candlestick will be located above and to the right of the previous one.
Price Range
The distance between the top of the upper shadow and the bottom of the lower shadow is the range the price moved through during the time frame of the candlestick chart. The price range is calculated by subtracting the lower price from the higher price.
Now, as we know the basic components, let us dig into how to read candlestick charts.
A trend is when something is going in one direction constantly for a while. A stock market trend may last up to a second, a minute, an hour, or even decades.
There are three steps to identify a trend on a candlestick chart; they are as follows:
First, just take a quick look at the chart. Check the direction the stock is going. (Up, down, or sideways)
Second, now zoom into the chart and try to analyse the intermediate terms highs and lows through the trend.
Third, try to make a rational guess about where we stand in the trend. Use the above two steps to guess where we stand, i.e., closer to a low or a high?
Highs and lows, peaks and valleys
After making a rational guess of what the trend direction is. You need to perform some trend analysis to get a better idea of how the trend is playing out.
The peaks and valleys in the stock trends are the most important factors to be kept in mind while performing the trend analysis.
Having peaks and valleys that are higher than previous peaks and valleys is a sign of a strong trend.
Example of Candlestick charts
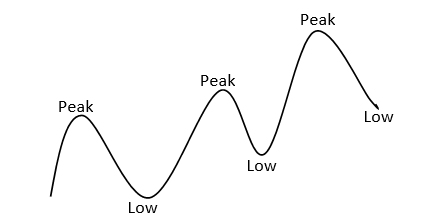
The above diagram shows that the stock rises and falls, but each time successive peaks and lows are higher than the last.
When a trend is not a higher high or a higher low, it should be considered to be a weak trend at the least and a trend reversal at worst.
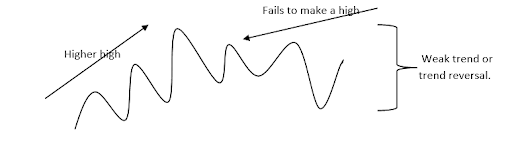
Now, to make a rational guess, you need to first measure the gap between peaks and lows.
Whether it is increasing or decreasing over time, this will give a rough idea of how long it takes for a peak-to-low to occur and how considerable the price changes will be.
How are Candlestick charts different from Bar Charts?
In the candlestick, just below the main body, there are wicks. The wicks show the highest and lowest trading price for the day’s trading. If the upper shadow on a down candle is short, it indicates that the high was closer to the open for the day.
A short upper wick indicates that the close was near the high. The shape, colour, and length of the day’s candlestick depend on the relationship between the day’s open, close, high, and low.
Bar charts consist of multiple price bars, with each bar representing how the price of a stock has moved over some time. Each bar chart shows open, high, low, and close prices. The vertical lines on the chart represent the low and high for the period.
Bar charts and candlesticks show the same information but in a different manner.
Candlestick charts are more expressive in terms of picturing and visualising due to the colour coding set for the price bars and body, which is better at showing the difference between the high and low in the market for the period.
Conclusion
Analysing the price movement of shares in the market often helps investors to earn profits on trading and even in investments. As we understood, a candlestick chart is a quick way to analyse the price trends of stock of the company in the stock market.
Knowing how to read candlestick charts also helps the investor to know the attitude of the traders and the investors in the market; how the investors see the stock. A pictorial presentation of the ups and downs of the market is easy to read if one has a keen eye and an understanding of candlestick charts.