Does buying a home score over investing in stocks? The question we Indians have been grappling with as we look for steady and superior returns.
what is more beneficial buying a home or investing in stock trading online
As a child, I remember my grandparents always sharing this one financial wisdom with my parents; “Zameen aur sona kabhi paise nahi dubaate (You won’t ever lose your money if you invest in property or gold)” and my parents used to be like “Ji-Thik-hai”.
I am sure we all must have heard something similar from our parents or grandparents and this knowledge has been flowing down across generations.
Now, instead of buying this fact blindly as an age old financial wisdom; let us explore something called as the internet database and analyse the historical returns of investing in Real-Estate and the Indian stock market benchmark indices to figure out which one is better.
Let us consider the real estate returns all-over India over the past few years. A Technical Advisory Group (TAG) – constituting of the RBI, Ministry of Finance and NHB; maintain an index that quantifies the returns on real estate investments called The NHB housing Index (Residex) – a good metric to quantify the real estate returns in various cities all over the country.
The data for the years 2007-2015 is available; with the 2007 index assumed to be 100 for all cities (Source :- NHB Site)
Always do better Investment
Join Us to Invest in Stocks
City Wise Housing Index :-
| CITIES | 2007 | 2012 | 2013 | 2013 | 2013 | 2013 | 2014 | 2014 | 2014 | 2014 | 2015 | CAGR |
|---|---|---|---|---|---|---|---|---|---|---|---|---|
| Index | Q4 | Q3 | Q2 | Q1 | Q4 | Q3 | Q2 | Q1 | Q4 | Q1 | 7.39% | |
| Hyderabad | 100 | 90 | 88 | 84 | 88 | 93 | 95 | 95 | 93 | 95 | 97 | -0.38% |
| Faridabad | 100 | 205 | 207 | 202 | 204 | 209 | 209 | 211 | 216 | 222 | 224 | 10.61% |
| Patna | 100 | 151 | 152 | 147 | 150 | 159 | 150 | 154 | 153 | 157 | 160 | 6.05% |
| Ahmedabad | 100 | 191 | 192 | 186 | 191 | 197 | 209 | 213 | 217 | 215 | 215 | 10.04% |
| Chennai | 100 | 314 | 310 | 303 | 318 | 330 | 349 | 355 | 362 | 366 | 364 | 17.53% |
| Jaipur | 100 | 87 | 112 | 110 | 108 | 105 | 101 | 102 | 101 | 103 | 102 | 0.25% |
| Lucknow | 100 | 189 | 183 | 187 | 191 | 185 | 194 | 193 | 196 | 198 | 200 | 9.05% |
| Pune | 100 | 205 | 221 | 219 | 219 | 235 | 232 | 241 | 242 | 247 | 251 | 12.19% |
| Surat | 100 | 150 | 140 | 142 | 145 | 154 | 165 | 161 | 160 | 164 | 168 | 6.70% |
| Kochi | 100 | 87 | 89 | 86 | 86 | 85 | 85 | 86 | 88 | 88 | 88 | -1.59% |
| Bhopal | 100 | 216 | 230 | 227 | 220 | 223 | 226 | 229 | 232 | 233 | 239 | 11.51% |
| Kolkata | 100 | 209 | 197 | 189 | 199 | 196 | 206 | 211 | 209 | 215 | 212 | 9.85% |
| Mumbai | 100 | 217 | 222 | 221 | 222 | 222 | 229 | 233 | 238 | 240 | 238 | 11.45% |
| Bengaluru | 100 | 106 | 109 | 108 | 107 | 111 | 107 | 108 | 109 | 113 | 115 | 1.76% |
| Delhi | 100 | 195 | 202 | 199 | 190 | 196 | 199 | 193 | 189 | 189 | 190 | 8.35% |
| Bhubaneswar | 100 | 172 | 197 | 195 | 193 | 202 | 195 | 196 | 197 | 192 | 188 | 8.21% |
| Guwahati | 100 | 166 | 153 | 147 | 149 | 160 | 154 | 159 | 160 | 163 | 168 | 6.70% |
| Ludhiana | 100 | 179 | 167 | 157 | 150 | 150 | 145 | 147 | 146 | 147 | 145 | 4.75% |
| Vijayawada | 100 | 185 | 184 | 174 | 167 | 161 | 160 | 163 | 161 | 162 | 163 | 6.30% |
| Indore | 100 | 194 | 195 | 184 | 180 | 184 | 181 | 187 | 188 | 191 | 195 | 8.71% |
| Chandigarh | 100 | 194 | 191 | 192 | 188 | 183 | 175 | 174 | 173 | 169 | 6.78% | |
| Coimbatore | 100 | 184 | 178 | 178 | 173 | 170 | 176 | 180 | 176 | 179 | 7.55% | |
| Dehradun | 100 | 183 | 184 | 184 | 186 | 191 | 187 | 188 | 187 | 190 | 8.35% | |
| Meerut | 100 | 191 | 189 | 176 | 171 | 165 | 159 | 159 | 161 | 163 | 6.30% | |
| Nagpur | 100 | 163 | 168 | 162 | 175 | 180 | 181 | 180 | 184 | 187 | 8.14% | |
| Raipur | 100 | 156 | 155 | 157 | 159 | 166 | 166 | 165 | 171 | 173 | 7.09% |
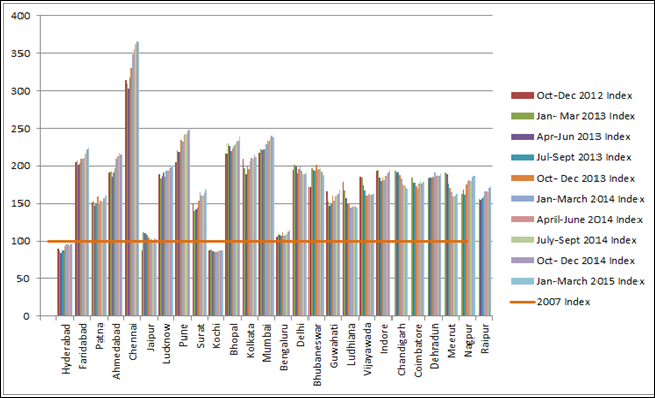
The data above suggests the CAGR can be different for different regions and ranges from -1.59% to 17.53% on an annualized basis. Just like stock markets, there would be businesses which will underperform and outperform the benchmark indices over time. Hence, it is wiser to consider the averages to give an unbiased perspective. Comparing one region returns is like comparing one stock or sector performance and it might not give the complete picture. Another important observation is the volatility of the index. To get a sense of the volatility of returns we can have a look at the below quarterly chart of real estate city indices.

Also Read : Fixed Deposit v/s Equities – Which is better?
A real estate portfolio comprising of properties in the above-mentioned cities would have yielded an average compounded average growth returns (CAGR) of 7.39% over the period of 2007-2015. The return would underperform the fixed deposits during the same period even after the effects of tax are considered.

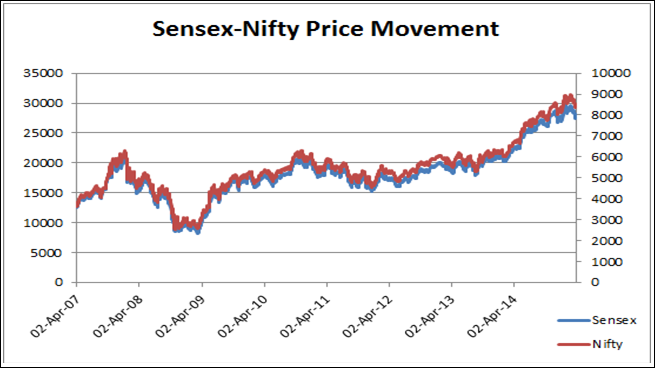
Now let us compare the real estate returns above with the returns that we would have generated from investing in an index or portfolio of individual stocks over the same years. (Source :- BSE India)
As you can see above, the price movement of the top two watched indices in our country, BSE Sensex and NSE Nifty-50. An investment made in 2007 till 2015 would have generated a CAGR return of 10.64% and 11.19% in SENSEX and Nifty-50 respectively. And if you would have invested your money with any of the top 5 names in the mutual fund industry, it would have given you an average annualised return of 18%. (Source :- Economic Times)
As for the risk involved in investing in the stock markets which is what is generally feared by any member of the bourgeoisie; I would like to highlight the most important point – the period that we have considered i.e. 2007-2015 has experienced one of the greatest falls (approx.. 60%)in our indices. Even after such a great fall the indices have beaten the real estate returns considerably. And these are lump sum investments made at a point. It’s advised to do a SIP in equities which reduces cash outlay at a particular time and can reduce average investment price in the longer run. Equities in the longer run have given close to 14% annualized.
No Objection Certificate, registration and maintenance costs can drag down the returns of a real estate investment.
Taxes apart from the costs should be a major consideration too. Long term capital gains taxes in stock market are zero according to current taxation laws in India which is defined as any investment held for more than a year. The tax liability of an individual invested in equities in the above example would be zero.
In real estate, capital gains on investments made for more than 3 years are classified as Long Term Capital Gains (LTCG).It’s highly unlikely that an individual makes an investment in a property for less than 3 years, so taxes must be accounted for. So let us do the calculations:
Illustrative Example for Long Term Capital Gain Tax on Sale of a House:-
Mr. Ram purchased a house for INR 45L in January 2010 and sold the house for INR 95L in Sep 2015. His brokerage charges amounted to INR 1L and the costs he incurred on improvement of the house in 2010 amounted to INR 5L. Since the sale of the house took place after three years from the date he purchased it, his long term capital gain can be calculated as follows:
Step 1 :- Calculate the Indexation Factor (Source :- BeMoneyAware) :
The cost inflation index for the purchase year 2010 is 711 and the cost inflation index for the sale year 2015 is 1081.Therefore the indexation factor is 1081 divided by 711, which is 1.52.
Step 2 :- Calculate the Indexed Acquisition Cost:
This can be calculated by multiplying the purchase price of the house, which is INR 45L with the indexation factor of 1.52.Therefore the Indexed Acquisition Cost is 45L X 1.52 = 68.4L.
Step 3 :- Calculate the Indexed Home Improvement Cost:
This can be calculated by multiplying the home improvement costs, which amounts to INR 5L with the indexation factor of 1.52.Therefore the Indexed Home Improvement Cost is 5L X 1.52 = 7.6L.
Step 4 :- Calculate the Long Term Capital Gain on the sale of the house:-
| Particulars | Amount in Rupees |
| Sale price of the house | 95,00,000 |
| Less: Any transfer expenses brokerage etc. | 1,00,000 |
| Net Sale Consideration | 94,00,000 |
| Less: Indexed acquisition cost of the house | 68,40,000 |
| Less: Indexed house improvement costs | 7,60,000 |
| Gross Long Term Capital Gain | 18,00,000 |
| Net Long Term Capital Gain | 18,00,000 |
On the amount of INR 18L and taxation rate of 20% results in a Long Term Capital Gain Tax of INR 3.6L.So in the above example Mr Ram invested INR 51L (45L+1L+5L) over time in the house and netted INR 91.4L (95L-3.6L) at the end of his investment. That is a CAGR of around 11% for the period which is not a bad return even after the effect of taxes and maintenance costs.
Also Read : How returns from various asset classes are taxed?
Equities vs Real estate? Who is the winner?
With the data and example mentioned above it’s not an easy choice when you consider all the factors. Equity benchmarks over the longer run have averaged around 14% if one had made SIPs. Real estate can generate returns probably a bit lesser but it depends on the geography and property one invests in. Careful consideration should be made to understand the differences which come from costs and taxes apart from real estate being an illiquid and lump sum investment compared to equities. Since all the investments in equities are electronic these days a person can encash his equity investments with a click of a button. On the other hand, real estate in India because of huge demand has lesser volatility as an asset class, provides a usage asset wherein one can live and also get home loans to fund it. The readers should also consider the legal aspects in real estate as there have been cases of frauds (recently Unitech). Diversification across asset classes and time frames is always recommended. The final thought is buy real estate for security and family but when it comes to superior return expectations, choose equity markets.
And The Winner Is Equities
So Click Here to Start Trading
[email-subscribers namefield=”NO” desc=”Subscribe now to get latest updates!” group=”Public”]


[…] Also Read : Does Buying a Home Score Over Investing in Stocks? […]
[…] Also Read : Does Buying a Home Score Over Investing in Stocks? […]
[…] Also Read : Does Buying a Home Score Over Investing in Stocks? […]
[…] Also Read : Does Buying a Home Score Over Investing in Stocks? […]